A real life story and a free trading strategy that changed my life

WHO AM I?
- Full time trader specializing in currency trading (forex). I also trade commodities, stocks, cryptos and indices.
- Crypto enthusiast, philanthrope, who loves coding (my new passion).
- Strategy developer, algorithmic trading.
- Private and group trading mentor.

WHAT IS THIS ARTICLE ABOUT?
– A real life story about dreams, hopes, wishes, disappointment, success and motivation.
– A 100% completely free and super simple trading strategy, proven to work for years.
If you are here for the free trading strategy alone, feel free to skip to the end.
However, if you want to hear my story, and hopefully learn something from it- keep reading. I know that many will related to my story and I hope the text below will motivate you enough to pursue whatever it is that you are after at the moment.
Table Of Contents:
THE BEGINNING OF THE END?
THIS IS NOT FOR ME, I WILL QUIT
THE BREAKOUT POINT
Higher time frames vs the lower time frames
Reason #1 more free time
Reason #2 – market manipulation
Reason #3 news events
Reason #4 Ideal for part time traders
Reason #5 HIGHER accuracy
SUMMARY – Higher Time Frames vs Lower Time Frames
LEVELS – The 8th wonder of the world!
(Support / Resistance zones)
What types of trade levels are there?
What is the big secret with levels a.k.a support resistance zones?
Price Action and Indicators
TRADING METHODS PROVEN TO WORK FOR YEARS AND THE $99 HOLY GRAILS
What to look for when purchasing trading products or services? How to identify forex scams and other trading related scams?
Risk Reward Ratio Can Change Your Trading Career
Multi Time Frame Analysis
Psychology
THE FREE TRADING STRATEGY THAT CHANGED MY LIFE AND DOUBLED MY ACCOUNT FOR THE FIRST TIME
THE ORIGINAL IDEA OF THE TRADING STRATEGY
MY TWEAKS AND IMPROVEMENTS TO THE STRATEGY
What is a divergence?
How to spot a divergences?
How does the divergence looks like?
How to draw a trend line correctly?
ENTRY SIGNAL, STOP LOSS (TRADE PROTECTION)
SUMMARY OF THE TRADE PLAN
Trade Examples
Example #1 – Sell Setup.
Example #2 – Sell Setup.
Example #3 – Buy Setup.
Example #4 – Buy setup.
FAQ – Most Frequent Questions about this strategy are listed below:
THE BEGINNING OF THE END?
Feels like it’s been ages since I first got involved in the fascinating world of trading. My journey wasn’t a straight, smooth line up to the success. I’ve experienced a lot of “drawdowns” and “pullbacks” on the way to becoming a profitable trader.
That brings us to the subject of this article. I’d like to share a personal story and one of my trading methods (really really really successful trading method) that is correlated to this specific story and in a way changed my life for good. Don’t worry both are completely 100% free.
As we build ourselves as traders, we go through a variety of steps or process flow. Somewhere in the early stages of this process flow, there is a stage where you are right after – “Buying because the candle is green” – but still lacking enough skills, knowledge and experience to extract money out of the markets. This is the stage where you feel comfortable, optimistic, you think risk and money management are not mandatory fractals of your trading plan and overall it feels like the first summer vacation that you spend without your parents.
Unfortunately the nature of the retail trading business could be alluring but beneath the surface of promises and dreams, a completely different ecosystem is ruling. Ecosystem which I would compare to the wild jungle. It will eat you up and spit you out within minutes/hours if you are not careful and prepared. Sadly most beginner retail traders are neither careful nor prepared. These new traders fall inside the vortex of false claims, exaggerated statements, unrealistic dreams and promises, very high expectations…
Needless to say what is the final result.
This is where I was. I had some knowledge now. I wasn’t just buying and selling like a caveman. How hard could it be right? And then boom – wake up call. You just blew up your first account. Congratulations and welcome to the club of miserable dreamers!
THIS IS NOT FOR ME, I WILL QUIT
I was on the verge of quitting. It made no sense. Everyone was making shit load of money (at least that’s what i was thinking, based on the ads and banners), and I wasn’t. How come? Maybe I’m not cut out for it? Maybe I’m not smart enough?
I’ve decided to give it one last shot. This is when I found/created the strategy that changed my life, doubled my next account and gave me the motivation to continue.
We will get to the details of the strategy in a bit, keep reading.
Now back to the blown up account.
Nothing can be compared to the first account you lose. If you haven’t done so yet, first of all well done!!!! Second let me try to explain it to you. Imagine a mixture of the scariest rollercoaster ride + being heartbroken (puppy love heartbreak) + Schindler’s list + Skydiving. Maybe now you have a vague idea. Why does it happen like that? Easy – it involves money but this time it was all you. There is no stock broker or financial adviser to blame. ALL YOU!
THE BREAKOUT POINT
And for me that was really the wake up call. I’ve stopped to assess what how and where. There was something I was missing. After A LOT more reading, almost no trading and plenty of research i’ve started to figure some things out. Here is a short list of my thought process, which by the way applies until today for myself:
- Higher Time Frames vs the Lower Time Frames
- Levels (any type of S/R zone – horizontal/dynamic)
- Price Action vs indicators.
- Trading methods proven to work for years (before the era of marketing hype/dreams and 99$ holy grails)
- Risk Reward Ratio
- Multi Time Frame Analysis
- Psychology and does your trading method(s) fit inside your comfort zone?
- How to distinguish real education from marketing/sellers?
I was in a trap and the bullet points above were my “manual” on how to build a ladder. If I could answer the questions i would most likely decipher it.
Now let me tell you something, i was never THE BEST in anything at that stage of my life (18-20 y). Very few people are. I was not the smartest, fastest or whatever BUT one of my strengths was and still is the fact that once I get interested in something, I become a bulldog. I don’t let go until I master it or at least become very proficient in it.
Let’s go back to the bullet points above and dig a bit deeper.
Higher time frames vs the lower time frames
There are numerous advantages of trading the higher/mid time frames (anything above H1 chart). Don’t get me wrong, I know traders who have mastered the “scalping craft” but if we assume 5% of the traders around the globe are profitable, we have around 1% out of these 5% who are profitable on the M1/M5 charts. It is possible, anything is possible.
We put a man on the moon for crying out loud BUT it is much harder and without going into too much detail here, the trading method that you will apply on those time frames has a huge difference as opposed to the higher time frames, where almost any trading idea could be successful as long as you have strong risk and money management.
On the other hand trading the higher time frames, has many pros.
Reason #1 more free time
It requires much less time scanning the charts. That means a lot more time for family, friends, kids, dogs, gym, beach, writing poems… It is one of the fundamentals why many people start trading: money and more free time. People often forget about the ultimate goals in this business.
Reason #2 – market manipulation
It is statistically proven that the more you trade (manual trading) the worse your performance becomes. In other words, more trades = less money. In other words, the lower the time frame, the more signals you get, the more you trade = less money. You follow me here?
So why does it happen? Because the lower time frames are exposed to algos from the big guys (smart money – banks, funds etc), brokers can do a lot more manipulating on a trade based on M1, compared to trade based on H4/D1. What does that mean? On M1 your stop loss is what – 5 pips? How much is your spread? How easy is for the broker to expand that spread to kick you stop and move on?
Think about H4. How big is your stop toward the next support/resistance zone? 50, 100 pips? Would it be that easy for the broker to widen the spread by 20-30 pips? I don’t think so.
Reason #3 news events
News are an inevitable part of trading. Especially short term trading (trades that usually take hours/days to develop, no long term investments that you would hold for years). There are plenty of news/reports/speeches based on economical factors etc…. that will move the market. Unfortunately many times you will end up on the wrong side of the move, only to find out that few hours later the price is moving in the very same direction as your original entry.
Why does that happen?
First of all we need to understand the fine difference between major events (speeches,tweets lately 🙂 , natural disasters etc) that could change the trend of an asset quickly and for a very long time. On the other hand there are economical indicators released monthly or bi-monthly for example, that will move the market in the short term, but the price will continue in the original direction, before the release.
So when I’m talking about being protected against news spikes, I’m referring to the second one. Being in a very short term trade during such events is more or less a gamble. However if your trade is based on H4/D1 setups, such intraday fluctuations will not do much harm.
Reason #4 Ideal for part time traders
Since you are not required to check the charts every few minutes/hours, trading the higher time frames is absolutely perfect for part time traders. If you are still working the 9-5 job, being a full time family person, there isn’t much time left for trading. Thus having 30-60 minutes a day, depending on how many instruments you follow, will be more than enough to follow the markets.
That time could be dramatically lowered if you switch to even higher time frames (Daily D1 /Weekly W1 /Monthly) and you use some type of breakout method as the free trading strategy that i’m going to share with you below.
This is exactly what happened with trading. I fell in love immediately. Maybe this is why i’ve decided to give it another shot after all the failures. No clue… Fact is I did.
Going over the list above, trying to crack the “manual”, by luck, fortune or I don’t know what… I somehow came across the free (worth billions though imo) trading strategy that gave me the push I desperately needed.
Reason #5 HIGHER accuracy
It is easy. I mean it. When you go to Daily and Weekly charts and you start analyzing, it just becomes easy. Tricky part is that you need bigger capital and a lot more patience. Something that the internet generation (like myself) has no idea what it means. We want everything now if not earlier. Another tricky part is the fees (swaps). Most of the times you will be paying fees while holding your position to the broker.
Nevertheless the setups are extremely accurate (if you know what to look for). You have all the time in the world to analyze, re-analyze, confirm and place your order. Which means, the profits at the end, should be worth it, even after paying the swaps and other fees.
SUMMARY – Higher Time Frames vs Lower Time Frames
- You get more free time.
- It is perfect for part time traders who can only spend 30-60 minutes a day/week.
- The accuracy of the patterns and signals on the higher time frames is astonishing.
- Not exposed to intraday price fluctuations/spikes caused by news events.
- Brokers cannot manipulate the price that easy when it comes to H4/D1 setups.
LEVELS – The 8th wonder of the world!
(Support / Resistance zones)
Levels are among the mandatory equipment that every trader should understand. They come in different forms and shapes but always mean the same thing – a strong zone where the price will very likely react from (breakout/bounce).
It doesn’t get simpler than that.
What types of trade levels are there?
- Fibonacci Levels (Fibonacci retracement, fibonacci expansion).
- Trend line levels (also called dynamic support/resistance zones).
- Horizontal support and resistance lines.
- Pivot points, Camarilla pivots and more in that category…
- Manually drawn horizontal levels (my favorite type!!!)
- Spikes from the higher time frames (Dailly, weekly, monthly charts). The price loves the spikes.
What is the big secret with levels a.k.a support resistance zones?
Actually there are a few.
- Surprisingly large part of the traders are underestimating the power of Support and Resistance zones. There are entire strategies based on S/R trading! I really don’t understand how some people are not considering it in their analysis. So this is really important, simple but important, always always always include levels in your trading analysis.
- The more the better! Confluence of multiple types of levels is the best thing that will happen to you as a trader. Once you learn how to identify those, next is easy – you just need a trigger to open the trade. Seriously, the more the better. Imagine you have trend line which also fits perfectly with fibonacci expansion level… Beautifulness! Now imagine this is happening on the Weekly chart. Shut up and take my money.
- Levels (support/resistance zones) are fantastic for Opening trades (entry), Protecting your trades (stop loss), and for Target levels (take profit). They really can do all that!!
If you have troubles identifying support/resistance levels you may use indicators like this one to help you identify key zones.
Here are some of the features:
- it is extremely fast (compared to the competition) due to the different algorithm used for detecting the zones.
- automatically adjusts – it shows levels for all visible bars on the chart. Simply zoom in/zoom out or change the time frame to change the range the indicator is working with.
- turn on/turn off shortcut button on the chart.
- always on function (if you would like to have it present at all times you can do that).
- visual customizations (display it left/right + adjust size of the levels/rectangles on the chart).


What do we see here? What does the market tell us?
- Sharp move down. We can immediately conclude that there is a bearish trend (downtrend).
- Next see how the move down was strong with large candles while the move up after that, was slow, taking much more time, smaller candles. What does that tell you? Where do you expect to see the price going after that? If your bet is down, you would be correct. This is a classical example of an impulsive move, followed by correction or consolidation, then continuation in the original direction.
And here is what happened after… Was that hard to read? Did you need any expensive or complex software to do it for you?

Indicators on the other hand could be really helpful but if you are aware of their limitations and strengths. If you understand how they work and what they show.
We can split indicators into two categories: lagging and leading indicators. Lagging indicators are basically those that will take some numbers (usually from past prices) run those numbers in the formula and spit out some sort of result (for example a Moving Average line).
The other category aims to forecast where the price will go in the future.
I think that’s more than enough as an introduction as this is not the purpose of the article.
Bottom line is :
“PRICE IS ALWAYS SUPERIOR TO INDICATORS”
That means when the price action you are reading is not complying with whatever the indicator is telling you, you better listen to the price.
Let me try to illustrate what I mean. EURGBP D1 chart, Stochastic indicator:

You see where the indicator gave the signal for Overbought conditions? You see where the price moved on later on?
Indicators are awesome (as you will learn in the free strategy shared in this article) but you must know how to use them. Otherwise you are just a caveman in a spacecraft…
Remember I told you I was like a bulldog when I like something and I want to understand how it works and what it does? Well this is probably a great time to say that, you should break down into as smaller as possible pieces, your entire knowledge related to trading and study every single part of it on its own. By studying I mean wake up with it, breath with it, think about it while in the shower and always try to understand WHY.
Once you put all of these pieces together, you will be like a blind man who sees for the first time. This feeling doesn’t come as fast as blowing the account, it is a process but it is as powerful!
TRADING METHODS PROVEN TO WORK FOR YEARS AND THE $99 HOLY GRAILS
Marketing is probably one of the worst things that happened to humanity. No one likes ads, no one likes banners. Don’t get me wrong i’m also a seller but everything has limits. Selling products and services is one thing, selling dreams and hopes is another thing, especially when you know it is not true.
If you already got burned, good. This is the lesson of the “digital street”. Finding quality in the retail trading niche is a tough one. There are however a few tips which will help you in this mad mad world of marketing.
What to look for when purchasing trading products or services? How to identify forex scams and other trading related scams?
- Do your homework. Don’t do impulsive purchases. You didn’t pick your college in the spark of emotion, did you?
- Research as much as possible every single angle you can find and is available. Then research some more.
– Who is the person/company selling the product?
– How long is this person/company on the market?
– Any products from the past? Courses? Strategies? What are the reviews and feedback on those?
– What are the reviews, feedback, testimonials for the product or service that you would like to purchase?
– Do the testimonials look legit? It is the 21st digital century. If they can make Paul Walker appear live in a movie, how hard do you think it is to fake a testimonial?
– Don’t look at the testimonials on the official website. 99% of the time those will be fake.
– Check out third party websites (which could also be influenced, bought etc but it will be harder to do so). Look for reputable forums (forexpeacearmy for example) and look for quantity of reviews/ratings/testimonials. Not just 5 people. The more the better.
– Check out the negative reviews, learn to differentiate the valuable ones. Reviews such as “it didn’t work”, “I didn’t make any money” are not giving you much. Fortunately there are people out there who are willing to put the time to explain in detail some of the issues they encountered. Those are the reviews that have most value for you. A product might have a bad review due to bad support. That doesn’t mean the product itself is not good. It could mean the developer doesn’t have the capacity to allow quality support. - Buy relationship not products. Statements could be faked, testimonials could be faked, anything could be faked. Try to understand the person you are buying from, or the company. I’m always looking for open relations whether i’m working with a client or business partner. It all starts with trust. Dan Pena will strongly disagree with me, but I like having human factor attached to my business. You will be surprised how far you can go if you are straightforward and honest with the people you are working with.
- Check if what you are buying (if strategy) is a black box or the author reveals how it works. I’m a strong supporter of Intellectual Property but the basics should be out there available to you, giving you a rough idea at least of how the software works and what is the logic behind it.
I like innovation and I strongly support it. When you are buying a strategy though or a trading method try to identify pieces of long term proven methods in it. In other words look for logic in the way the product works.
Here is an example. A trading method which I developed, called FX Delta. The Delta pattern is the core of the system. The definition of the Delta Pattern is freely available not just to the members who purchased the strategy but to everyone. The whole strategy is 100% public and transparent. You can learn how to trade it here:
If all that seems like a lot of work or you believe you can’t do it, you have another option. Stick to methods from the old books. The trading strategy that we are going to learn here is exactly that.
Another proven method (a bit more complex I must say and probably suitable for the more advanced traders) is the Elliot Waves theory.
Risk Reward Ratio Can Change Your Trading Career
Another critical miss in my trading that lead me to failure back then, and I had to examine was the Risk Reward ratio.
This is basically how much you are willing to potentially lose, versus the potential profit. As a rule of thumb, we want to be risking less with the potential to win more – not a brainer. This way a negative success rate (you win 4 out of 10 trades for example) you are still making money or at least you are not losing money (breaking even).
Going back to the Levels. Now imagine you have a super strong level where the price is very likely to bounce off of. Do you think the risk reward ratio for this trade will be good?
Multi Time Frame Analysis
(free gift at the end of the paragraph)
The importance of the multi time frame analysis is tremendous. Imagine that you are going on a trip for a week. The winter season is near its ends but you can still expect snowfalls. You are leaving today and the weather happens to be spring-like.
Now what clothes do you pack?
– Option A – 1 light jacket, t-shirts, shorts and a pair of jeans, and your sneakers.
– Option B – Real winter jacket, sweaters, t-shirts, warm winter pants and boots.
You should focus on the larger picture which is: Winter! Doesn’t matter if this specific day is warm and nice outside. You should be prepared for snow and cold.
Same goes with trading. Don’t be focused on the very short term alone. You should have an idea what is going on in general. What is the trend in the higher time frames (D1/W1 maybe even monthly).
You are still going to trade on the lower time frames, but knowing the overall direction, you have completed 50% of the job already.
Psychology
Trading psychology is a subject that could be discussed for days. In the context of this article we should cover the part about how exactly does the trading method or strategy fits in your comfort zone.
- Does it fit there at all?
- Do you feel stressed when pulling the trigger? If not, why not? Identify the part that causes that.
- Have you tried different strategies and methods to have something to compare with?
- Reversal trading, trend trading?
Ask yourself these questions and try to figure out where is your comfort zone. A comfort zone means confidence. If you are confident about your entry, you are less likely to interfere with your position.
Let’s delve into that.
You see a setup. It is according to the rules, you pull the trigger. Now the price is simply not moving much, playing around the entry zone. Here is the key part. If there are no VALID arguments for you to close the trade, why would you do it? Beginner traders will cut the trade as soon as they see it going into the negative. A huge list of problems now unfolds…
On the other hand, if you are comfortable with your entries and type of trading, you are more likely to let the position do its job.
THE FREE TRADING STRATEGY THAT CHANGED MY LIFE AND DOUBLED MY ACCOUNT FOR THE FIRST TIME
Was it faith? Chance? Luck? I have no idea but I was really on the verge to leave trading and move on with my education when I came across this strategy.
This is when everything clicked. Pips started accumulating. Profits grew. The curve was finally going up.
In this chapter I will go as detailed as possible about each component of the strategy with examples attached to the theory.
So how did it happen? Let me first of all introduce you to the original idea before my modification.
THE ORIGINAL IDEA OF THE TRADING STRATEGY
The original idea is as old as the market itself. We draw a trend line from a significant swing in the direction of the current, ongoing trend. Then once the price comes closer to the trend line we are looking for entries (usually on a smaller time frame) in the direction of the trend, as long as there is no breakout of the trend line. Simple right?

I believe that genius is simplicity. This trading strategy is absolutely genius. Why?
- You are forced to identify the trend.
- You are trading with the trend (not trying to catch tops/bottoms of the market)
- Anyone with a bit of practice, can learn how to draw the correct trend lines and how to update them.
- The risk reward ratio is fantastic.
- It can be applied to any market (forex, stocks, indices, crypto … anything).
Can you ask for more when you are first starting? I don’t think so.
MY TWEAKS AND IMPROVEMENTS TO THE STRATEGY
As I was gaining more knowledge, I got familiar with divergences. Once I applied the divergence pattern to the original idea (just for entries) it all clicked. It is super important to mention that what you are going to learn below is extremely easy concept.
Before we move on, you should understand what is divergence, how to identify a divergence, what indicators to use when working with divergences and most of all – how to use the divergence for your entries.
What is a divergence?
A divergence is telling you that the ongoing trend is lacking momentum. The momentum is exhausted. Thus we can anticipate either a reversal or a pullback.
How to spot a divergences?
A divergence is usually identified on oscillator indicators, such as MACD, RSI. I personally love working with MACD (2 lines edition).
How does the divergence looks like?
Bearish Divergence – signaling for possible bearish pullback or bearish reversal. It happens when the price forms Higher Highs , while the indicator forms Lower Highs.
Example:

Bullish Divergence – suggests a possible bullish pullback or bullish reversal. It happens when the price is forming Lower Lows, which the indicator forms Higher Lows.
Example:

More Examples:
Bearish Divergence (USDJPY W1 chart):
Example:

Bullish Divergence (USDCAD W1 chart):

If it sounds complex and confusing in the beginning, trust me it will pass. Give a few hours/days of practice and you are all set. Just to get you started, here is the divergence cheat sheet for you to print out if needed:

Now let’s take a closer look at the first stage of this strategy – drawing a trend line. It looks very simple but for some reason, many traders fail to do it correctly. Don’t worry, it is not quantum mechanics, you just need to follow a few simple steps and rules.
How to draw a trend line correctly?
Once again, when we work with this trading strategy, we do two things. One – identify and draw a trend line on a higher time frame. Two – drop to a lower time frame and look for entries.
Step 1 – Switch to 1 time frame higher from the time frame you have decided to work with (for the trend line).
Example – if you want to draw H4 trend lines and look for entry setups on the H1 chart, Step 1 requires you to go to D1 chart (1 time frame higher than the H4 chart).
Step 2 – find the most recent swing high (for bearish trend lines) or the most recent swing low (for bullish trend lines). This swing high is the starting position of your trend line.
Step 3 – For bearish trend lines – start pushing the trend line towards the price from above. Once the trend line meets a High of any of the candles, you are done.
For bullish trend lines – start moving the trend line towards the price from below. Once you reach a Low, you are done.
Congratulations! You made it to the last part where the pieces of the puzzle will be put together. At that stage you know:
- How to draw valid trend lines.
- How to identify and work with divergences.
Last part is the easiest one – the entry!
ENTRY SIGNAL, STOP LOSS (TRADE PROTECTION)
The entry is based on a breakout. A breakout level which is the middle point of the divergence. What do I mean?

Which for this specific example means – once the price breaks below the low (the middle point of the divergence) we will be looking to sell.

Another example – this time we are using bullish divergence.

The stop loss is placed right below the 2nd low (of the divergence), basically the lowest point on the chart immediately before the breakout. Here is our bullish breakout once again, this time with stop loss:

And of course the same but vice versa for the bearish case. The stop loss goes right above the swing high. Here is another example:

HOW TO SEMI-AUTOMATE THE STATEGY?
I have developed two extremely useful tools in addition to the Levels indicators.
- One is to help me set/open the trades.
- The other one helps me manage the trades.
You can read more about the Spotlight Trader and Manager here – https://traders-terminal.com/spotlight-trader-manager/
This playlist of videos contains a lot of examples and explanations on how to use both apps + demonstration of use cases. For this specific strategy you may want to focus on the DRAWINGS modules.
Now let’s take a look at a few full trade examples.
SUMMARY OF THE TRADE PLAN
- Draw a trend line.
- Wait for the price to come closer to the trend line.
- Wait for bullish or bearish divergence (depending on the direction).
- Wait for breakout of the middle point of the divergence to enter a trade.
Trade Examples
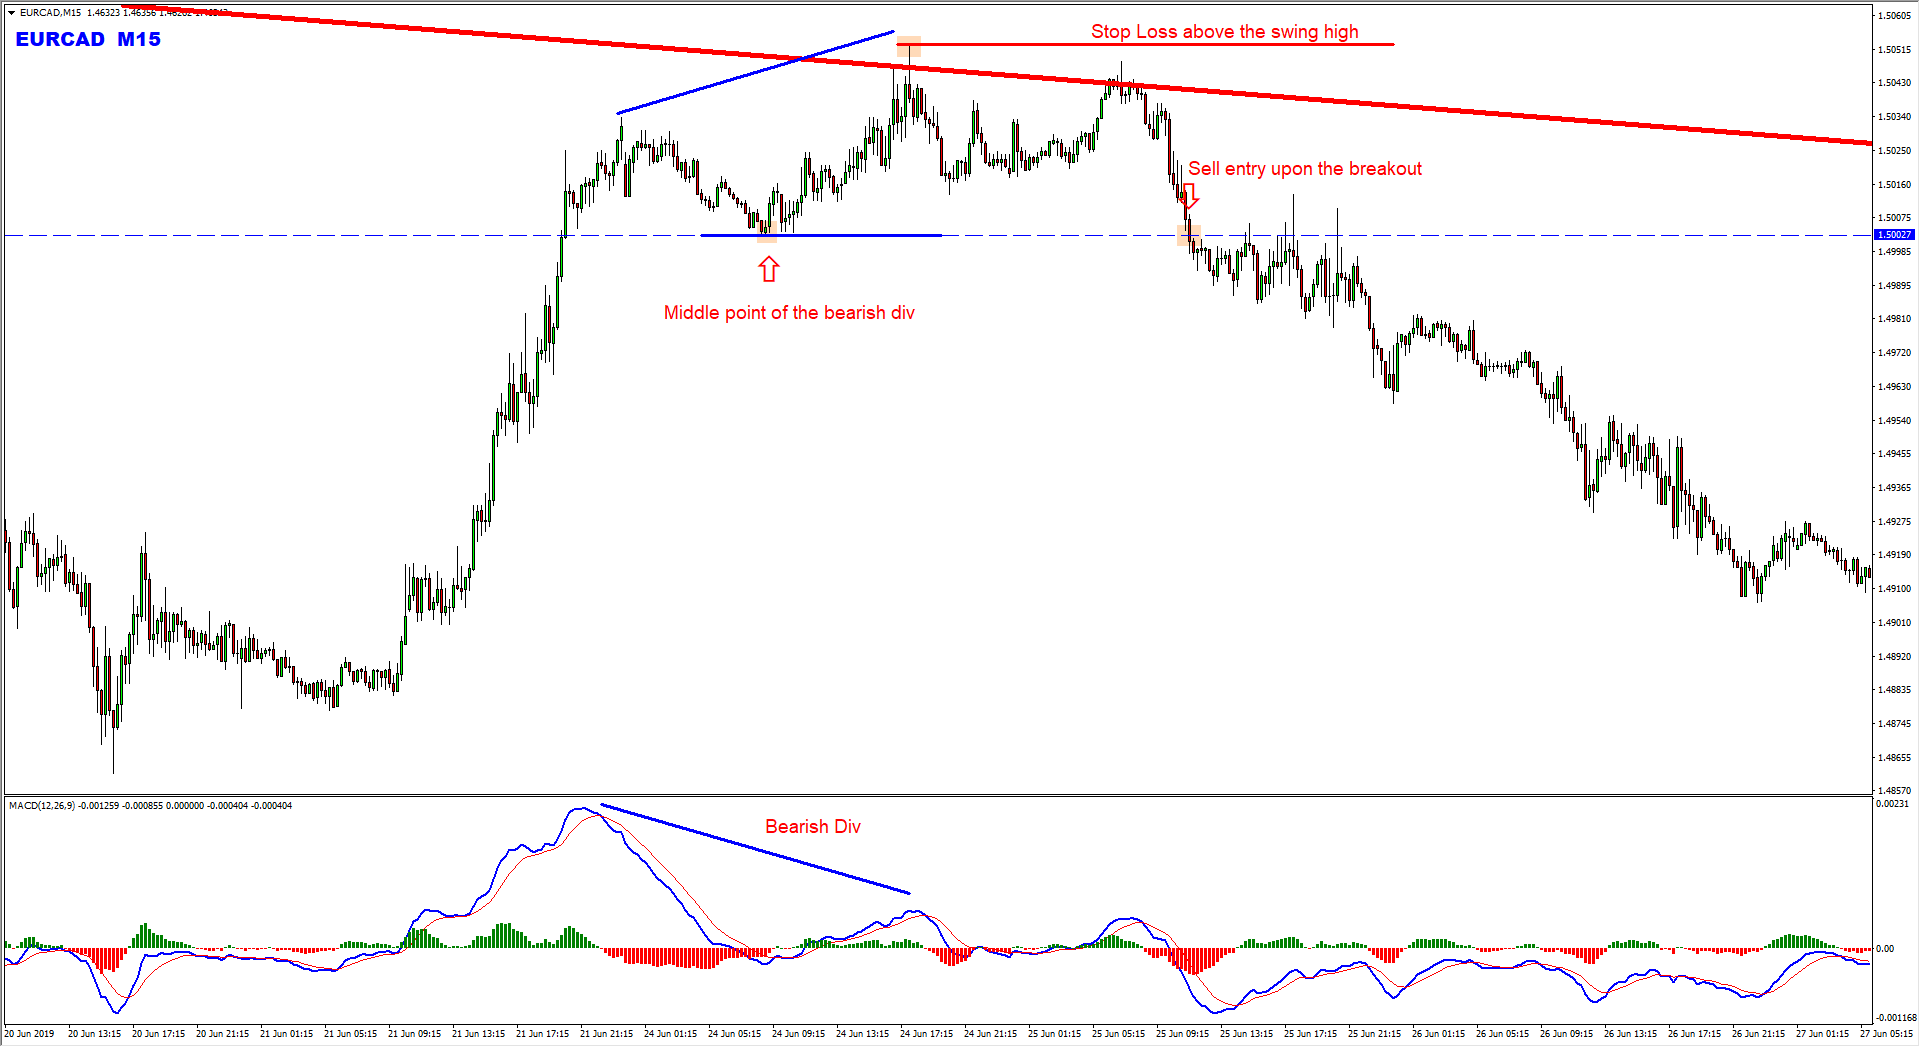
Example #1 – Sell Setup.
EURCAD H4 trend line + M15 chart trade setup (entry).
The H4 chart bearish trend line.

M15 chart – forms bearish divergence right at the trend line. Breakout of the middle point of the divergence follows which triggers the sell entry. Protection placed above the swing high. Target based on pure risk-reward ratio.
Example #2 – Sell Setup.
CADCHF D1 trend line + H4 chart entry setup
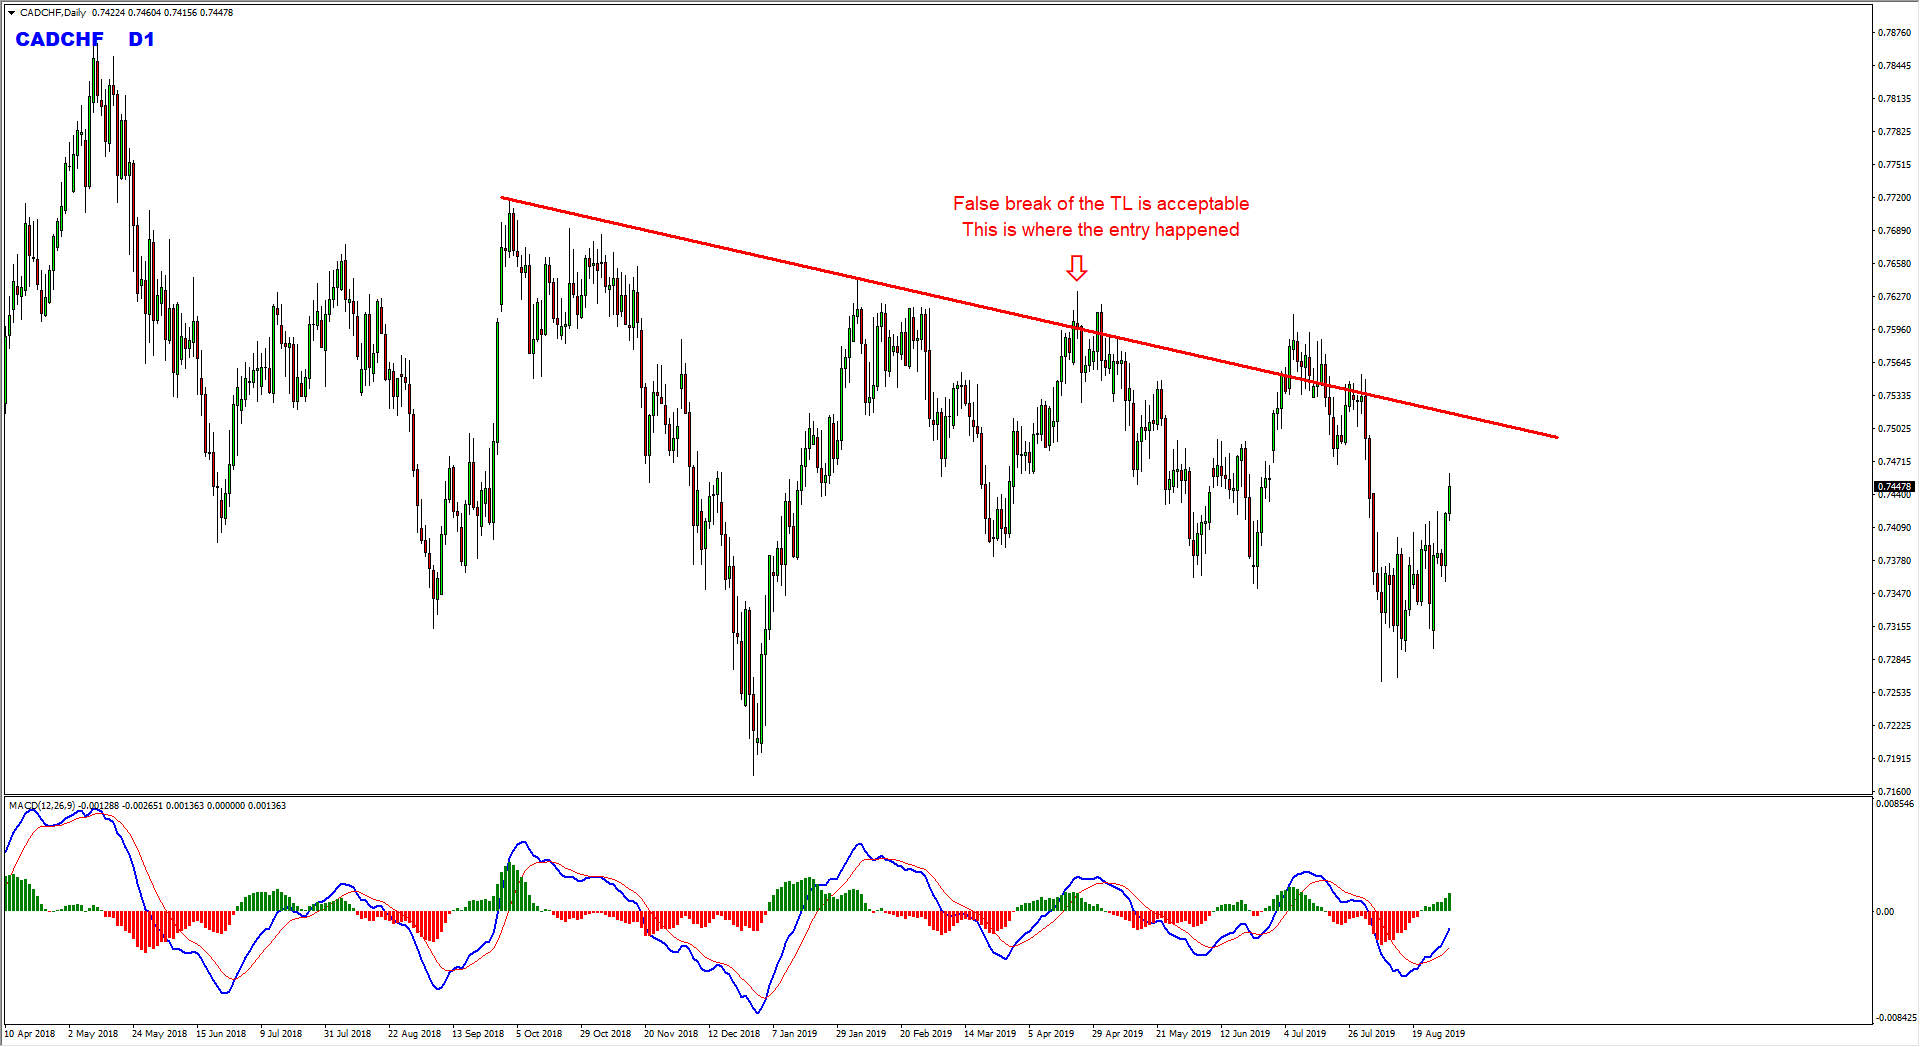
H4 chart – forms bearish divergence near the trend line. Breaks below the middle point of the divergence which triggers the sell entry. Stop loss is placed right above the swing high.

Example #3 – Buy Setup.
German DAX – H4 trend line + H1 chart entry.

H1 chart – forms bullish divergence near the trend line. Breaks above the middle point of the divergence which triggers the buy entry. Stop loss is placed right below the swing low.

Example #4 – Buy setup.
Facebook – H4 trend line + H1 chart entry.

H1 chart – forms bullish divergence near the trend line. Breaks above the middle point of the divergence which triggers the buy entry. Stop loss is placed right below the swing low.

FAQ
Most Frequent Questions about this trading strategy are listed below:
- What is the best time frame combination?
– You can use any time frame combination, but as a rule of thumb, keep in mind the higher the time frames, the more reliable the results are. You will not get same results trading M15 + M5 and D1 + H4. - How many time frames lower can you go for the entry?
– I never go more than 2 time frames lower (only exception is H4 where M30 is ignored, so H4 goes along with H1 and M15). Example D1 for trend line, you can find entries on H4 or H1. - What is the best indicator for spotting divergences?
– My favorites are MACD and RSI. - When using MACD to find divergences, should the divergence happen on Histogram, MAs or both simultaneously ?
– The divergence must be present on the MAs. Histogram is not mandatory requirement for me. - What is the optimal target (risk-reward ratio)?
– It depends on many factors. If price is moving in a clear channel for example, and market provides a nice entry with tiny stop loss, the risk reward ratio could reach 1:5, 1:8 and so on. There is no fixed rule for that. It all depends on the specific situation.
Are false breaks of the trend line acceptable?
– Yes. As long as the divergence is present.
In summary – this is one of the proven over the years strategies that keeps delivering consistently for me.
The simplicity of the main concept along with the extra touch added makes it absolutely perfect for beginners and advanced traders. If you are in the hunt for your first trading strategy, give it a go. If you already have a system or a strategy, consider this an addon to diversify.
Feel free to contact me in Telegram @yordan_k if you have any question or you just want to say hello…
Happy Trading!
Yordan K