Intraday trading, Returns and Time - The Easy Way
Most beginner traders (not investors) underestimate the power of the long term results and high probability setups
KEY TAKEAWAYS
- The logic in trading is the opposite from the logic in other businesses when it comes to volume.
- Short term trading doesn’t mean a lot of trading
- Why short term traders should focus on the long run?
- High probability setups and time
- The parallels between trading and investing
If you put in perspective the results that i’m going to assume below you will see how profitable you become thanks to discipline and patience. It is not about the strategy, the analysis or anything else. You just have to be patient and trade the high probability setups (check https://dtamasterclass.com/ for more info on the subject).
Of course if you lose 9 out of 10 trades and you risk $1 for the potential to win $1, this doesn’t apply to you. You have different problems to deal with.
IT IS BASIC MATH
One year equals 365 days. That gives us 12 months or 52 weeks. Now let’s deduct 3 weeks for vacation, 2 weeks of sick days, around a week for public holidays.
So far we have 52 – (3+2+1) = 46. If you think this number is not accurate, please use your own base number.
Now we are working with the assumption that there are 46 trading weeks. If you set a target of 1% net profit per week, that’s over 46% return per year (not compounding it) or 4% per month. let’s assume that this is the upper threshold.
Many traders that are just starting believe that 4% a month is absolutely terrible result. Believe me, if you can achieve even 2% a month, CONSISTENLY, over a long period of time, you will retire a millionaire.
My point is:
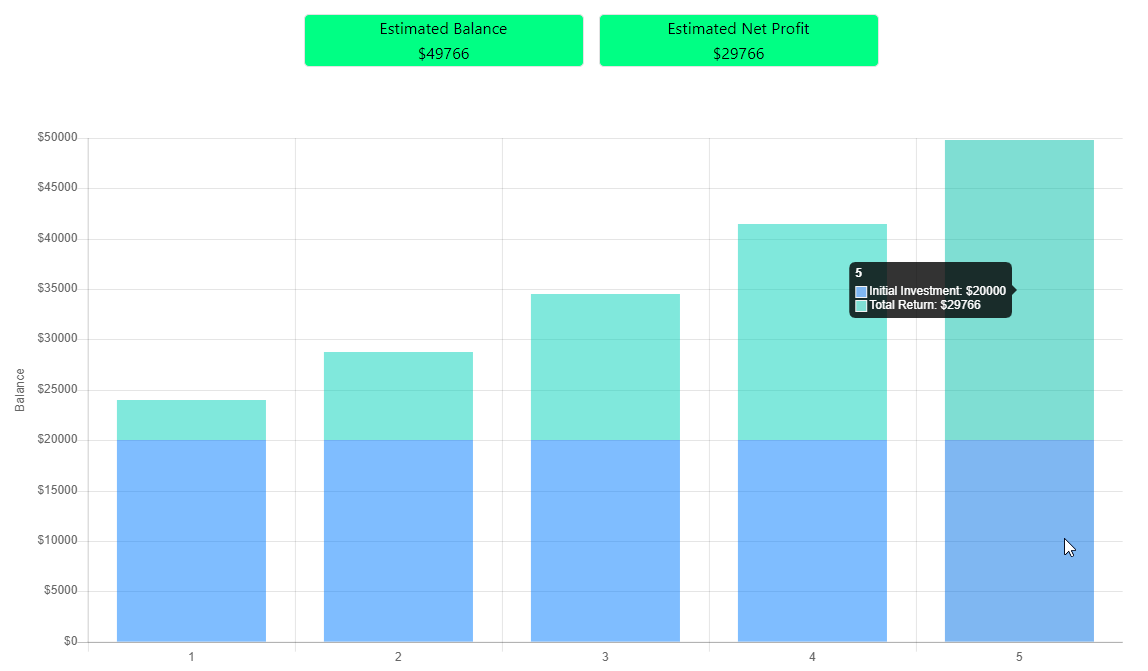
- Starting capital: 20k
- Annual Return: 20% (10 months * 2%)
- Time period: 5 years
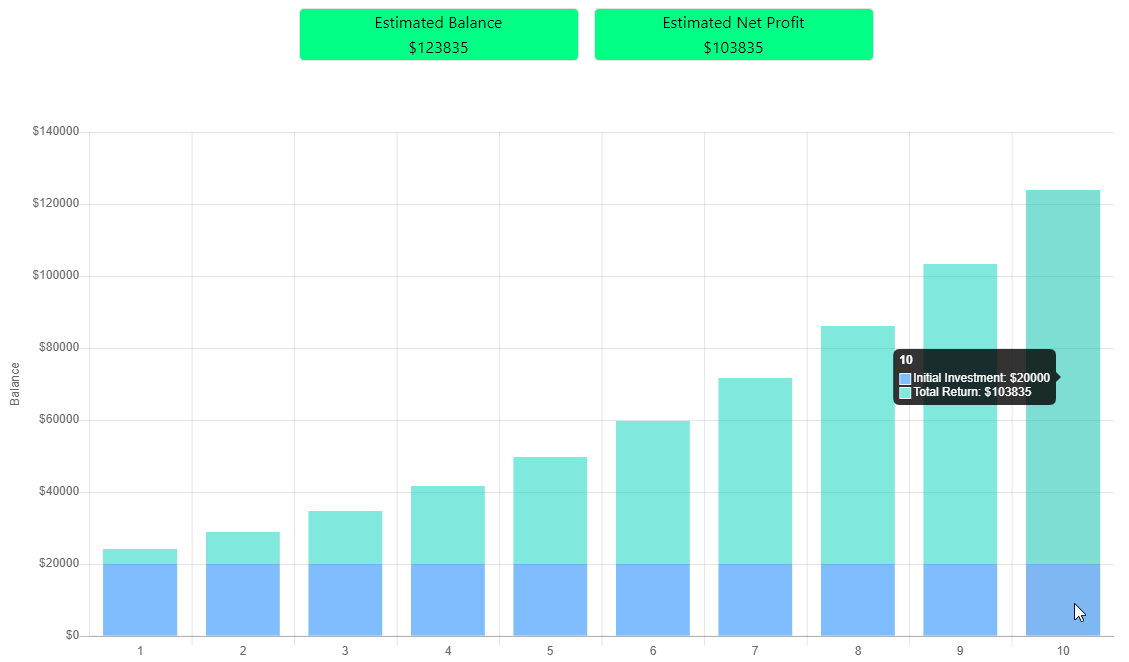
- Starting capital: 20k
- Annual Return: 20% (10 months * 2%)
- Time period: 10 years
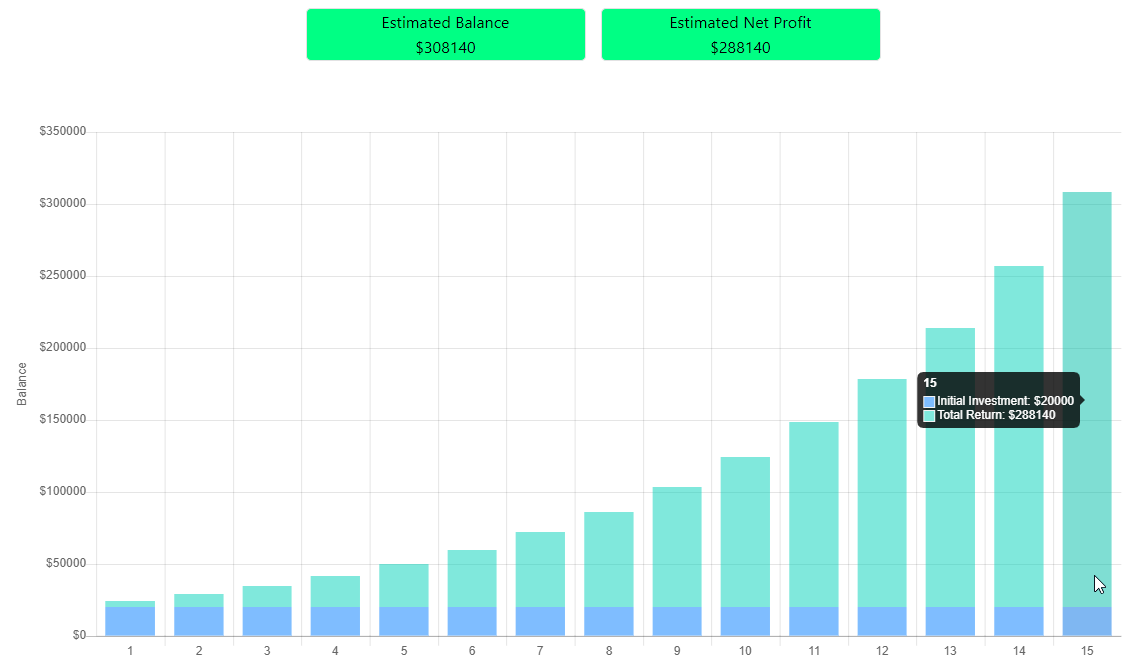
- Starting capital: 20k
- Annual Return: 20% (10 months * 2%)
- Time period: 15 years
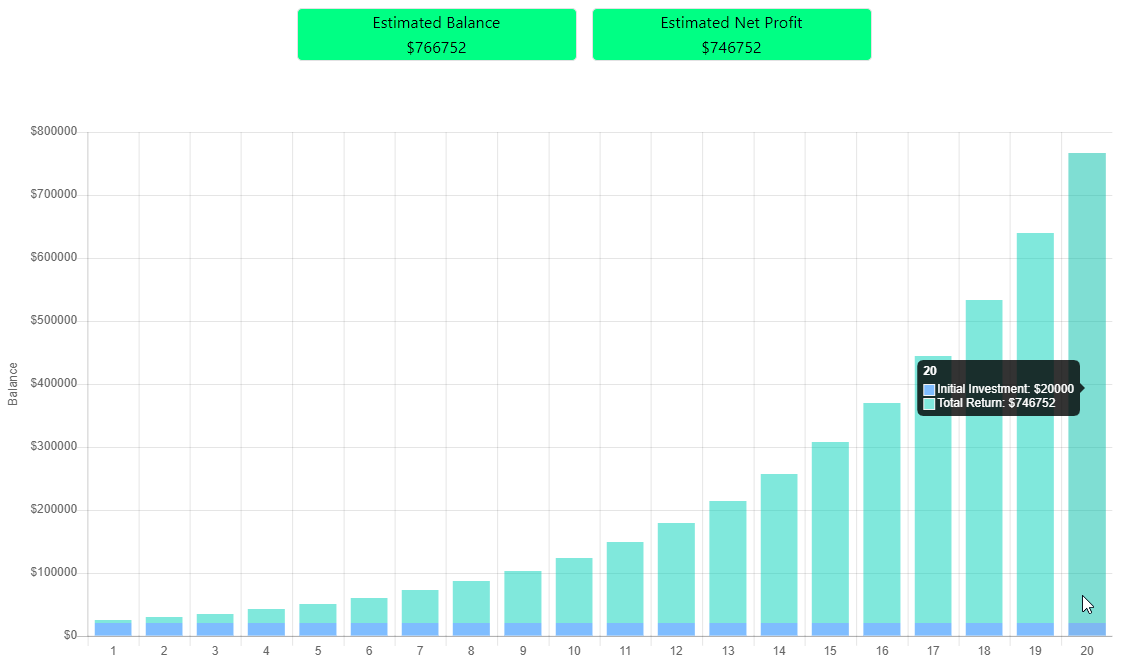
- Starting capital: 20k
- Annual Return: 20% (10 months * 2%)
- Time period: 20 years
- BE A SHORT TERM TRADER WITH LONG TERM GOALS
- AIM FOR CONSISTENCY, NOT EXTRAORDINARY
My personal goal is 2% per week for about 90% annual. God knows this is rarely achieved but it is within the realm of a realism. For many traders 1% per week might be too big of a goal, especially if you are not trading that frequent. For others that might be too low. That’s fine. Just keep an open mind and adapt the numbers to your personal case, time frame of your strategy etc.
The purpose of this blog post is to show what can be achieved with very little but high quality trading.
Now you should be asking yourself questions like:
- How many trades do I have per week/month on average?
- What is my risk per trade?
- What is my win ratio?
Let’s take a look at a few scenarios with different parameters.
Note – taxes and other fees are not taken into account.
In the first table we are going to play with the risk per trade. The parameters assumed are:
- Risk per trade = 0.5% .
- Risk-Reward Ratio = 1:1 .
- Win Ratio Percentage = 60%
| Risk Per Trade | 0.50% | ||
| R:R Ratio | 1:1 | ||
| Win Ratio % | 60.00% | ||
| Trades/Week | Trades/Month | Monthly ROI | Annual ROI (10 m/ 46 wks) |
| 1 | 4 | 1.20% | 12.00% |
| 2 | 8 | 2.40% | 24.00% |
| 3 | 12 | 3.60% | 36.00% |
| 4 | 16 | 4.80% | 48.00% |
| 5 | 20 | 6.00% | 60.00% |
| 6 | 24 | 7.20% | 72.00% |
| 7 | 28 | 8.40% | 84.00% |
| 8 | 32 | 9.60% | 96.00% |
| 9 | 36 | 10.80% | 108.00% |
| 10 | 40 | 12.00% | 120.00% |
The takeaway here is that if you manage to find and trade JUST ONE high probability setup per week, you are already beating the market (sp500 benchmark). Again our assumption is that you are trading roughly 10 months in total. The other two moths you are on vacation/sick/public holidays when the markets are closed etc…
Be honest with yourself now, is it realistic to assume that you can find 4 high probability trades every month? Trades where the chance of success are at least 60%?
Let’s take a look at scenario #2 where the risk per trade is increased from 0.5% to 0.75%.
| Risk Per Trade | 0.75% | ||
| R:R Ratio | 1:1 | ||
| Win Ratio % | 60.00% | ||
| Trades/Week | Trades/Month | Monthly ROI | Annual ROI (10 m/ 46 wks) |
| 1 | 4 | 1.80% | 18.00% |
| 2 | 8 | 3.60% | 36.00% |
| 3 | 12 | 5.40% | 54.00% |
| 4 | 16 | 7.20% | 72.00% |
| 5 | 20 | 9.00% | 90.00% |
| 6 | 24 | 10.80% | 108.00% |
| 7 | 28 | 12.60% | 126.00% |
| 8 | 32 | 14.40% | 144.00% |
| 9 | 36 | 16.20% | 162.00% |
| 10 | 40 | 18.00% | 180.00% |
A tiny increase of 0.25% makes a huge difference in the long run. Now you are looking at 18% annually. Small changes, applied for the long term, consistently, make HUGE difference. How many people do you know that are making 18% consistently on their accounts year over year?
The whole niche around retail trading is built on the premises that:
- retail traders lose money
- retail traders need to trade more, to lose more money
Almost no one is talking about trading LESS for higher probability trades. They don’t do it, because they want you to believe, the more you trade, the more money you will make. And if you think about it, this is actually legit argument in almost any other business.
If you own a restaurant, you want as many customers as possible to make more money. If you are selling shoes online, you want as many orders as possible. If you are working extra hours, you get paid overtime. So subconsciously, we are inclined to believe this thesis: more trades = more money/profit. Unfortunately, truth is , the less you trade (wait for high probability setups), the more money you make.
Ok, scenario #3. Risk per trade is now increased to 1%.
| Risk Per Trade | 1.00% | ||
| R:R Ratio | 1:1 | ||
| Win Ratio % | 60.00% | ||
| Trades/Week | Trades/Month | Monthly ROI | Annual ROI (10 m/ 46 wks) |
| 1 | 4 | 2.40% | 24.00% |
| 2 | 8 | 4.80% | 48.00% |
| 3 | 12 | 7.20% | 72.00% |
| 4 | 16 | 9.60% | 96.00% |
| 5 | 20 | 12.00% | 120.00% |
| 6 | 24 | 14.40% | 144.00% |
| 7 | 28 | 16.80% | 168.00% |
| 8 | 32 | 19.20% | 192.00% |
| 9 | 36 | 21.60% | 216.00% |
| 10 | 40 | 24.00% | 240.00% |
Again, you need to win 6 out of 10 trades with 1:1 risk reward ratio. That is definitely doable. Even though it doesn’t sound like a lot, when you look at the numbers in perspective, you see that this kind of trading with 1% per trade, yields 24% annually.
HOW LONG UNTIL YOU DOUBLE YOUR MONEY?
The next table assumes that you are not withdrawing money from this trading account. Here is the time and place to set your longer term, realistic and specific goals. How fast (ideally) would you like to double your money (on annual basis)?
| Annual ROI % | Years to Double | |
| SP500 | ~9-10 | ~10-11 |
| 0.50% | 12 | 8.3 |
| 0.75% | 18 | 5.6 |
| 1% | 24 | 4.2 |
Even one of the most conservative scenarios that we have considered here is making a huge difference in terms of years to double your money, compared to the average return of SP500.
SP500 AVERAGE YEARLY RETURNS IN THE LAST 150 YEARS
Speaking about the SP500 and longer term returns, it feels appropriate to involve and compare with “buy and hold” even though we can make the argument that this is comparing apples and oranges. Here is what the numbers are saying.
| Period 150 years – average returns | |
| Annualized Return % (incl dividends) | 9.0% |
| Annualized Return % (incl dividends + Infl Adj) | 6.80% |
| Annualized Return % (no dividends + Infl Adj) | 4.50% |
| Annualized Return % (no dividends) | 2.30% |
| Period 100 years – average returns | |
| Annualized Return % (incl dividends) | 10.2% |
| Annualized Return % (incl dividends + Infl Adj) | 7.10% |
| Annualized Return % (no dividends + Infl Adj) | 6.10% |
| Annualized Return % (no dividends) | 3.10% |
| Period 50 years – average returns | |
| Annualized Return % (incl dividends) | 10.3% |
| Annualized Return % (incl dividends + Infl Adj) | 6.00% |
| Annualized Return % (no dividends + Infl Adj) | 7.30% |
| Annualized Return % (no dividends) | 3.10% |
| Period 30 years – average returns | |
| Annualized Return % (incl dividends) | 9.6% |
| Annualized Return % (incl dividends + Infl Adj) | 7.00% |
| Annualized Return % (no dividends + Infl Adj) | 7.50% |
| Annualized Return % (no dividends) | 5.00% |
| Period 20 years – average returns | |
| Annualized Return % (incl dividends) | 9.5% |
| Annualized Return % (incl dividends + Infl Adj) | 7.00% |
| Annualized Return % (no dividends + Infl Adj) | 5.00% |
| Annualized Return % (no dividends) | 5.00% |
| Period 10 years – average returns | |
| Annualized Return % (incl dividends) | 11.9% |
| Annualized Return % (incl dividends + Infl Adj) | 9.10% |
| Annualized Return % (no dividends + Infl Adj) | 7.20% |
| Annualized Return % (no dividends) | 8.30% |
| Period 5 years – average returns | |
| Annualized Return % (incl dividends) | 10.0% |
| Annualized Return % (incl dividends + Infl Adj) | 6.00% |
| Annualized Return % (no dividends + Infl Adj) | 8.20% |
| Annualized Return % (no dividends) | 4.30% |
Of course there are a few “IFs” and “BUTs” when we assume these numbers.
Many times investors panic and sell at bottoms. Or life happens and you are just forced to cash out but not at optimal time.
Assuming that this is not going to happen to you, all else equal, let’s say you can achieve an average return of around 9-10% per year.
Another question – isn’t it better to have your funds at your disposal at all times? When you trade, you open a position, but that usually lasts from minutes to hours/days or a few weeks, depending on your trading style. So your money is “locked” but for considerable smaller amount of time.
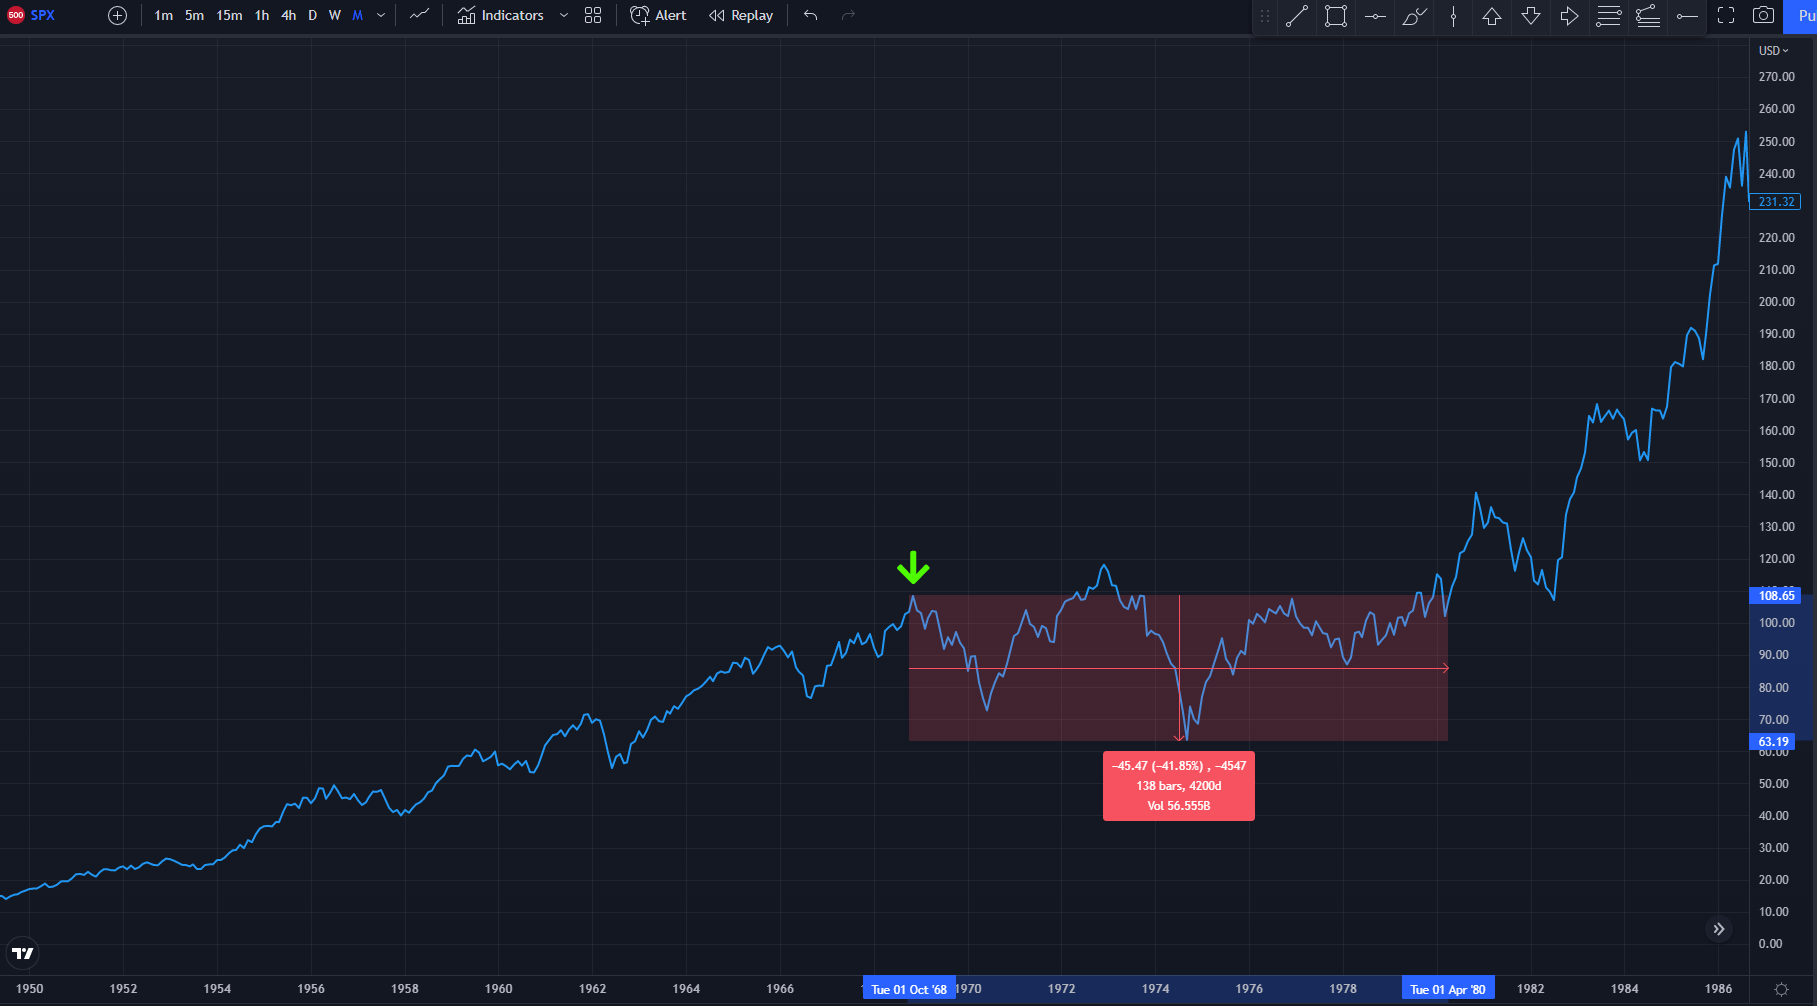
A LOOK AT THE DRAWDOWNS OF SP500
Investors on the other hand, are occasionally forced to wait for years, until the market comes back.
Here is what I mean. Imagine that for whatever reason (you got some inheritance money, you won the lottery, you landed your first job etc), you started investing right there where the green arrow is.
Essentially you are not going to see any returns from October 1968 till April 1980.
Another, more recent example is the dot com crash (2000), followed by the Great Financial Crisis in 2008. Given that you bought at the peak (where the green arrow is) you had to wait from August 2000 till February 2013 to start making some money.
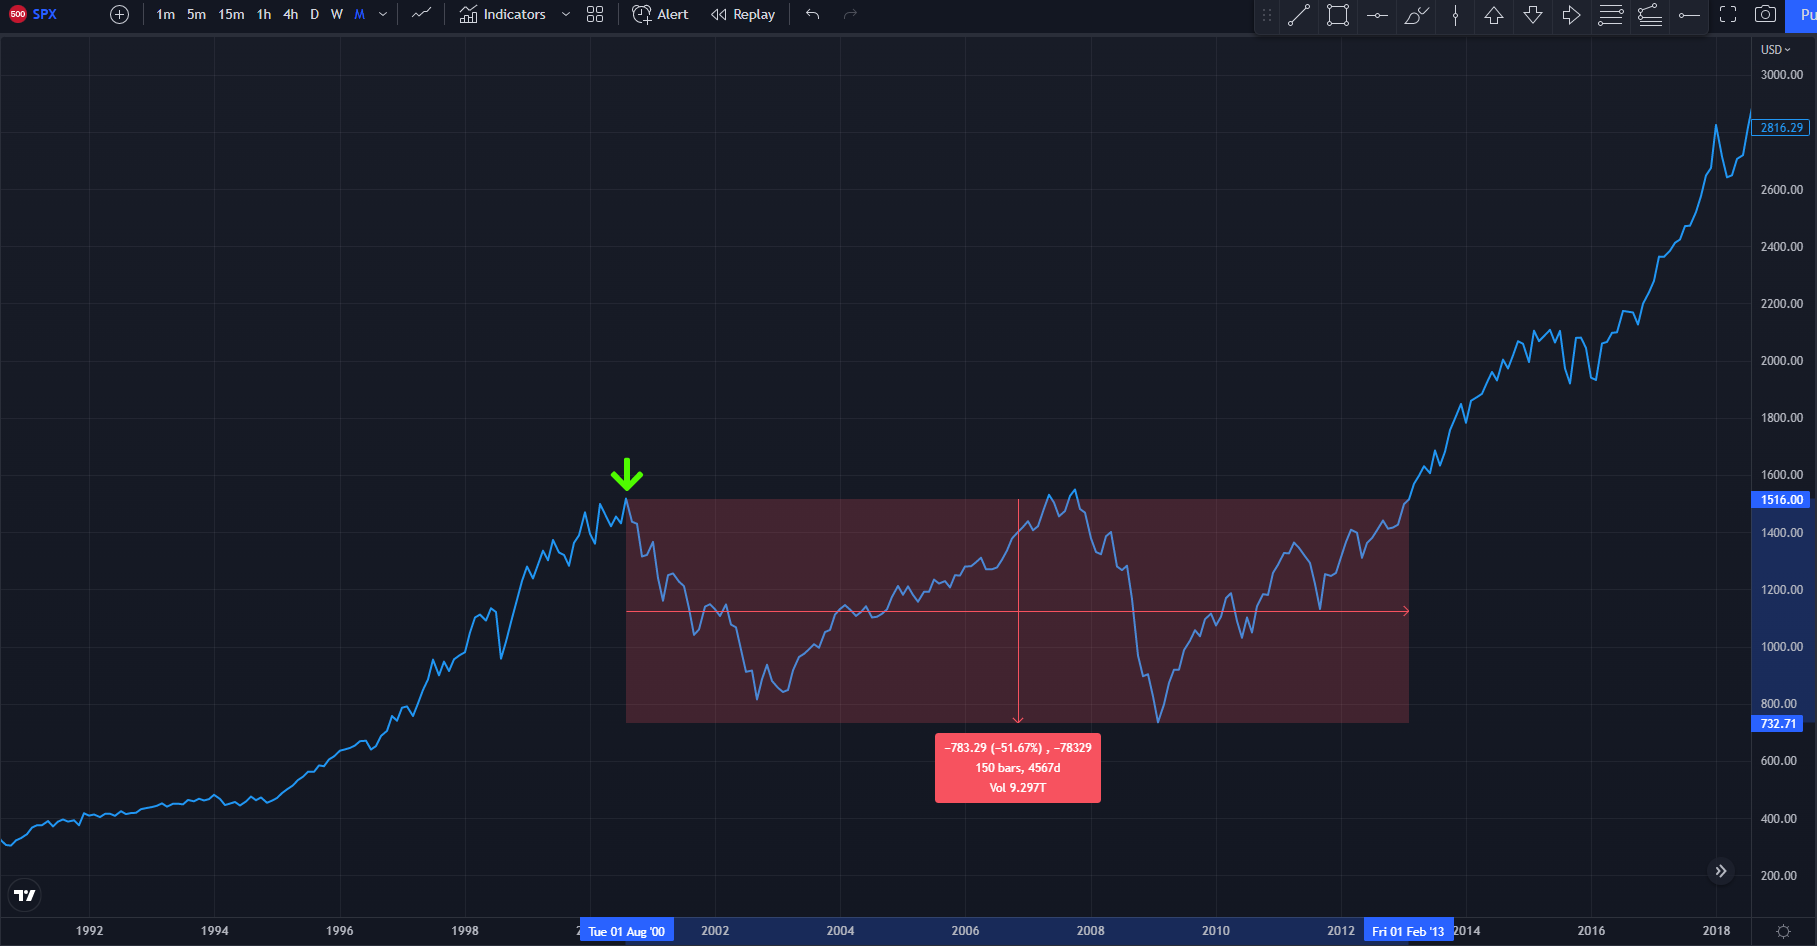
I’m NOT trying to bash investing. Investing is absolutely awesome if you have no idea about finance and you don’t want to learn the subject (like me and cars) that’s the way to go. But being a realist by studying the history gives you an advantage, that could save you a lot of sleepless nights.
THE HORROR STORY OF NIKKEI 225
To my point, here is the chart of the Japanese equivalent of Dow Jones, the NIKKEI 225. Those who invested in late 80’s, up until January 1990 (the top) are still waiting for the market to recover to the all time high. At the moment of writing (November 2022) that means over 30 years. So yes, technically speaking, if you are still holding your investment you haven’t booked a loss (realized loss).
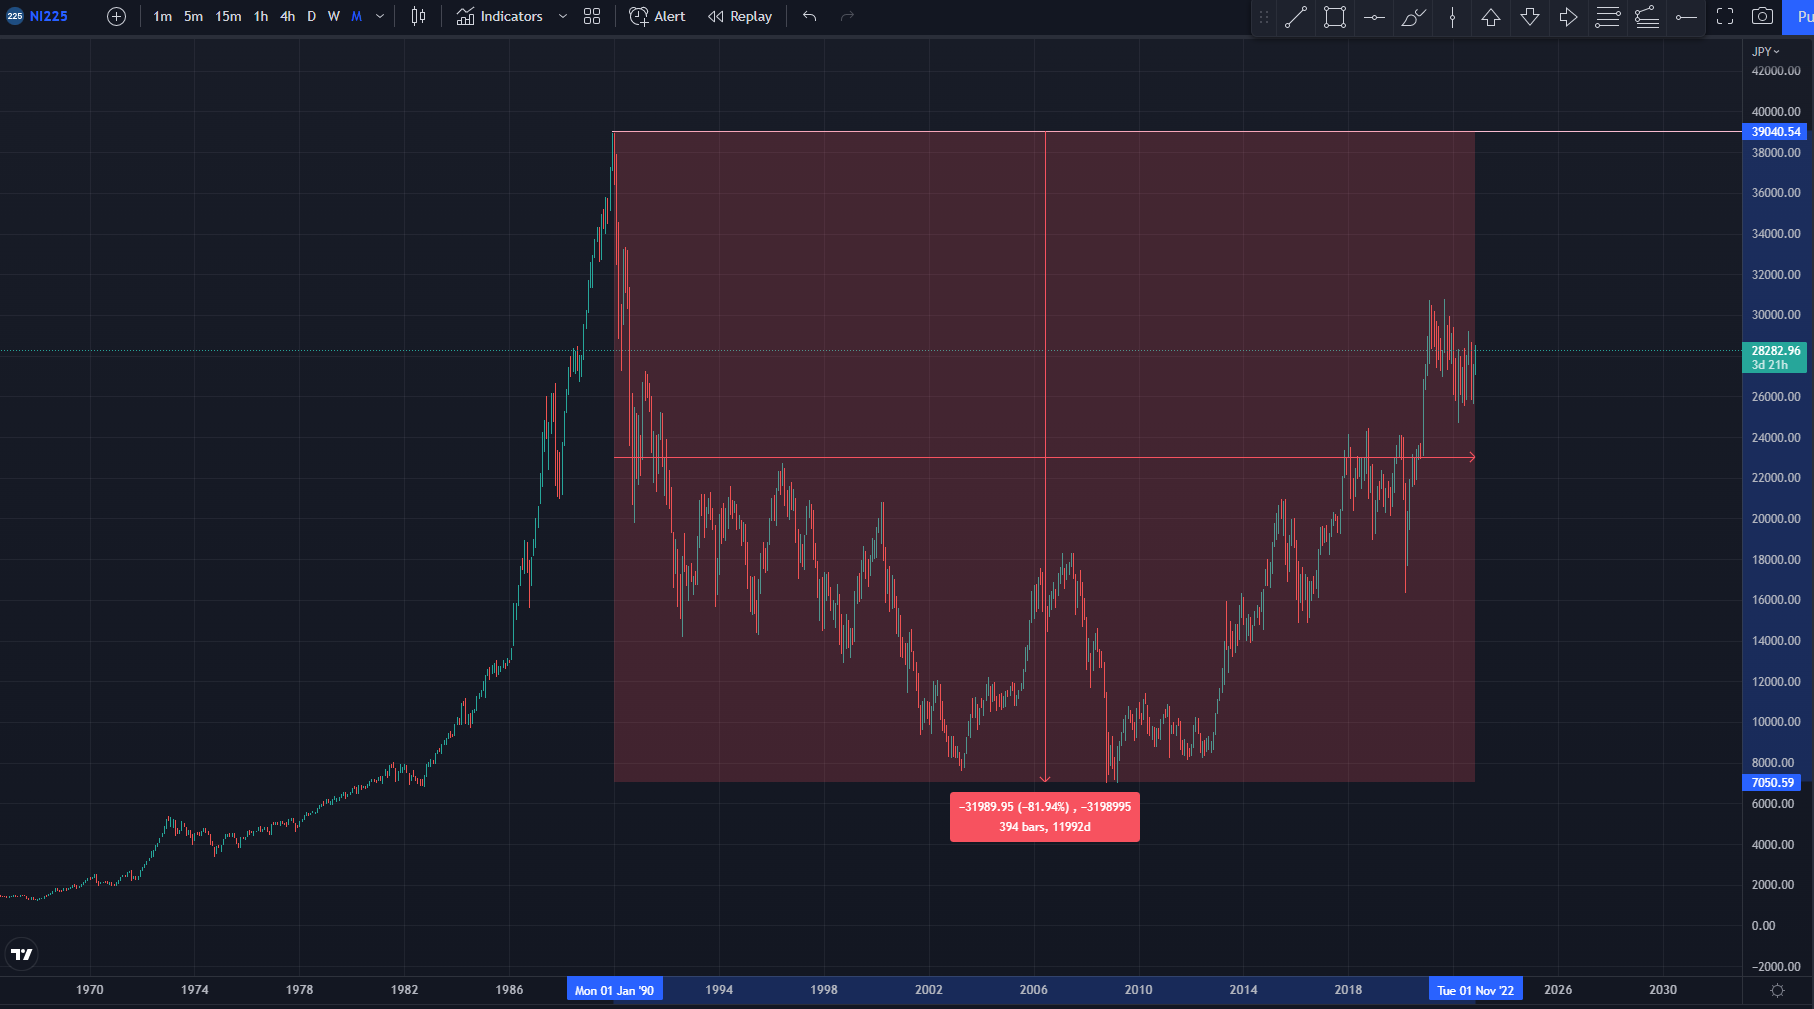
However, investing is NOT risk free. Imagine you invested your life time savings, at the age of 50 or even 40 in 1990. It is terrifying even to think about it.
INVESTING VS TRADING
For most people, investing is the way to go. No thinking required. The catch with investing is TIME. If you have time, you will go through this cycles, and given that you don’t panic sell, you will be fine. If you are in your 40s or above though, can you really wait 10-12 years, to get to break even? Even if we consider the 2007/8 peak, that would cost you almost 8 years.
Those who want to go the extra mile, can consider trading. The catch in trading is RISK. Here you can lose all your money, compared to investing where if you go with buy and hold (index) chances are you make money in the long run. Risk versus Reward. The potential to make more money versus the more “conservative”, “secure” approach for less money.
Which way to go clearly depends on many factors.
WHAT IF WE TAKE THE IDEA TO THE NEXT LEVEL?
Ok going back to the main idea of this post. Think about the following for a second. What if you have 3 strategies. What if your goal is to find JUST ONE high probability entry setup for the entire week, PER STRATEGY?
That leaves you with the potential to score 2 or 3 high probability setups every week.
Let’s take the lower numbers. Always assume the less favorable case, as in reality, chances are you are going to be closer to the less favorable scenarios. That being said, here are the highlights of the 3 risk profiles that we have seen above (0.5% per trade / 0.7% and 1%):
| Trades/Week | Trades/Month | Monthly ROI | Annual ROI (10 m/ 46 wks) |
| 2 | 8 | 2.40% | 24.00% |
| 2 | 8 | 3.60% | 36.00% |
| 2 | 8 | 4.80% | 48.00% |
HOW TO PICK HIGH PROBABILITY SETUPS?
A high probability trading setup, by definition is a trading opportunity that has a large chance of success. The DTA Framework teaches exactly that. How to pick high probability setups.
It includes my proprietary trading strategies and soon we are launching the DT-Units which is a great way for traders to join forces.
If you would like to learn more, please check out the official website https://dtamasterclass.com/
CONCLUSION
Numbers don’t lie. Trust me, in this business less is more, slow is fast.
Yordan Kuzmanov