If it’s codable, a probability percentage is obtainable!
Busting myths, proving/disproving theories and statements, collecting raw data and combining small independent blocks into powerful expert advisor based on empirical data.
BULLISH ENGULFING
Statistical analysis on the Bullish Engulfing Japanese candlestick pattern. Using 5 years worth of data to obtain the results.
Pattern: BULLISH ENGULFING.
Pattern consists of: 2 candles.
Definition of the pattern:
Candle 2 – Bearish.
Candle 1 – Bullish.
Candle 1 – Closes above the high of candle 2.
Candle 1 – Low is lower than the low of candle 2.
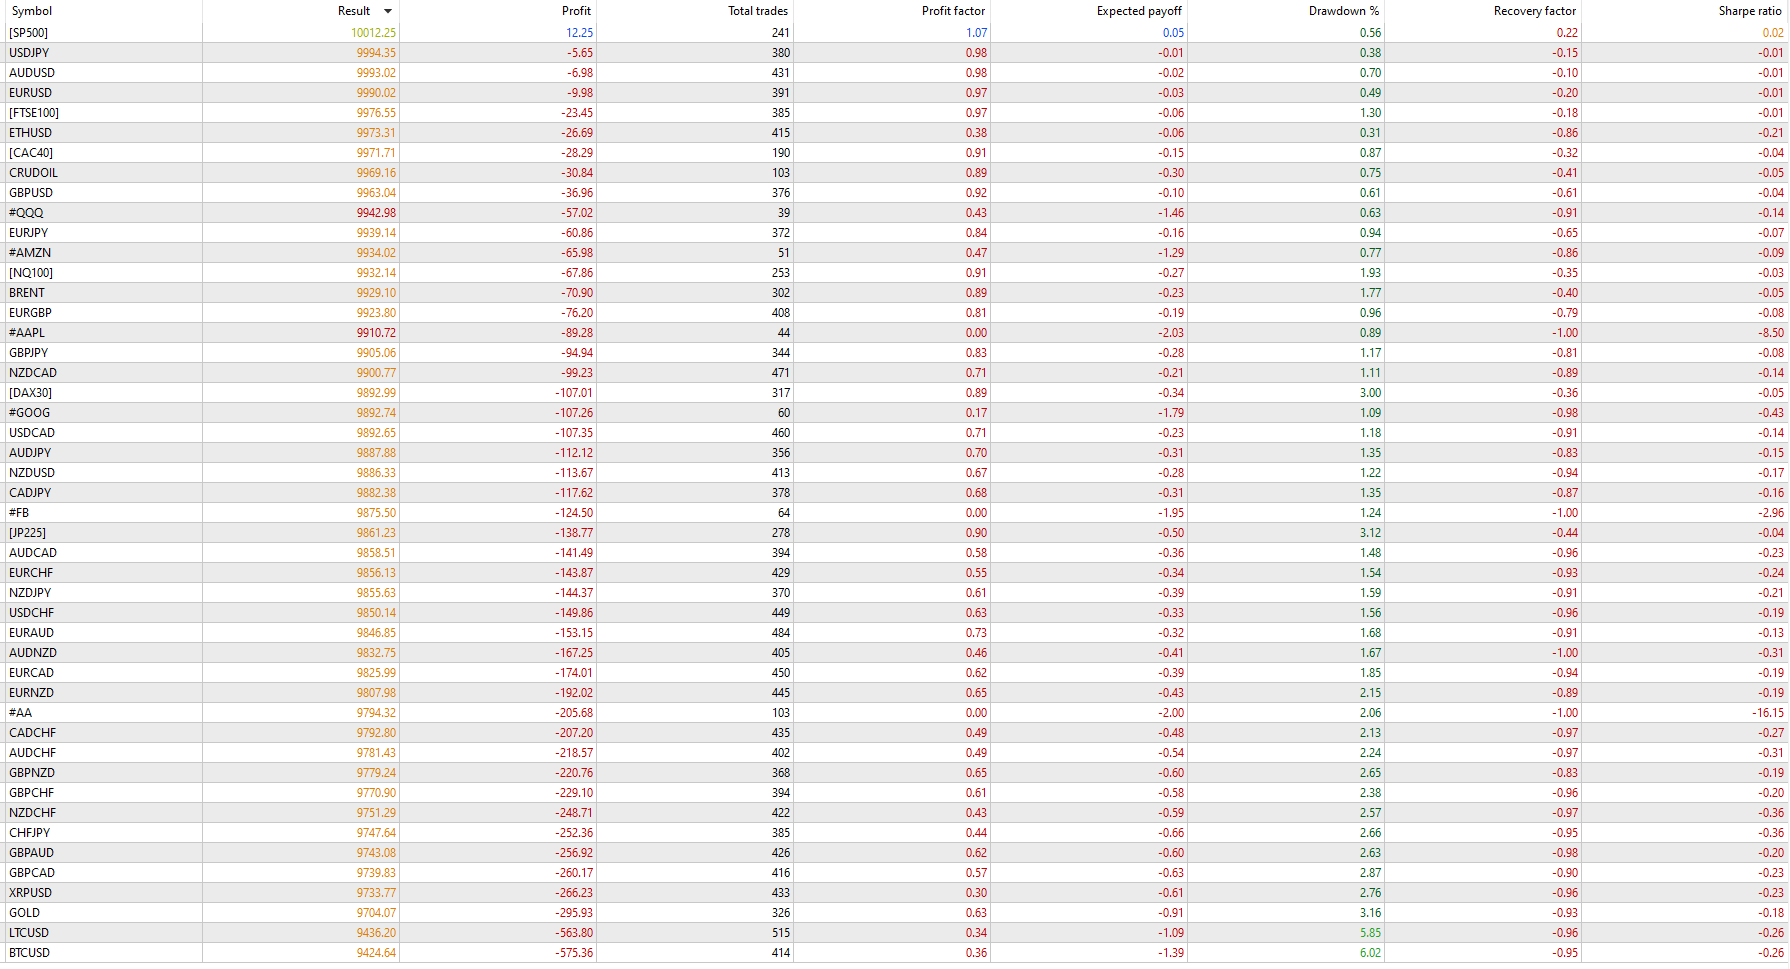
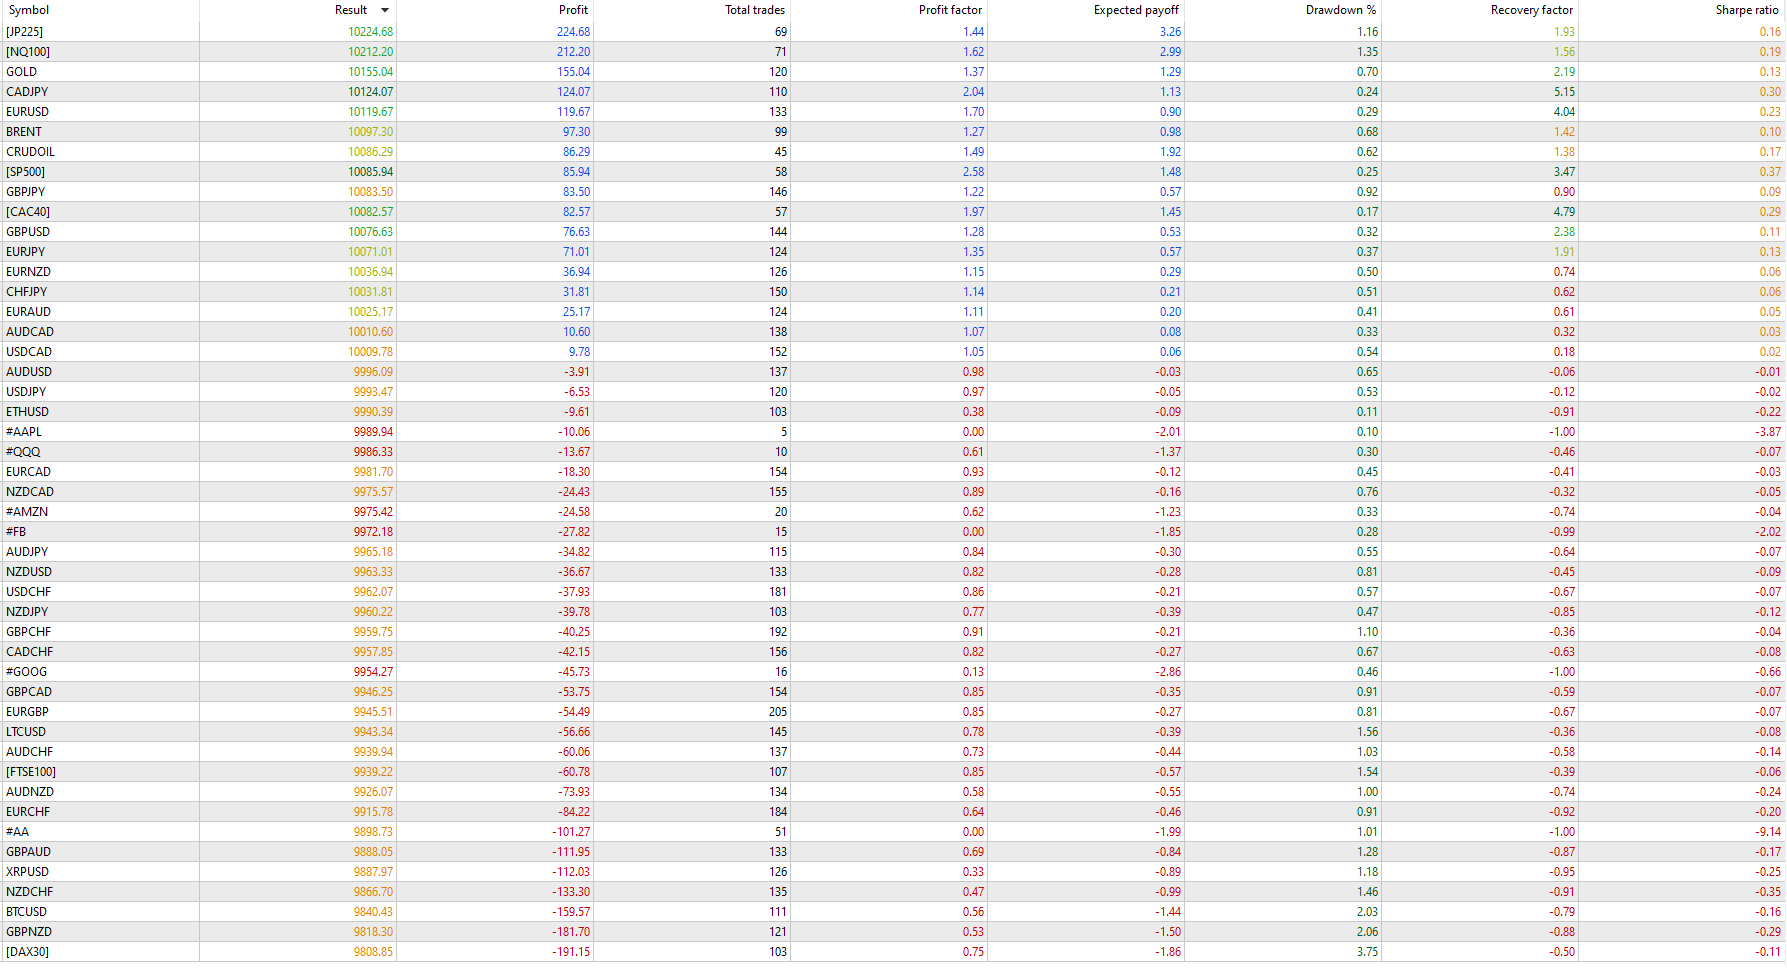
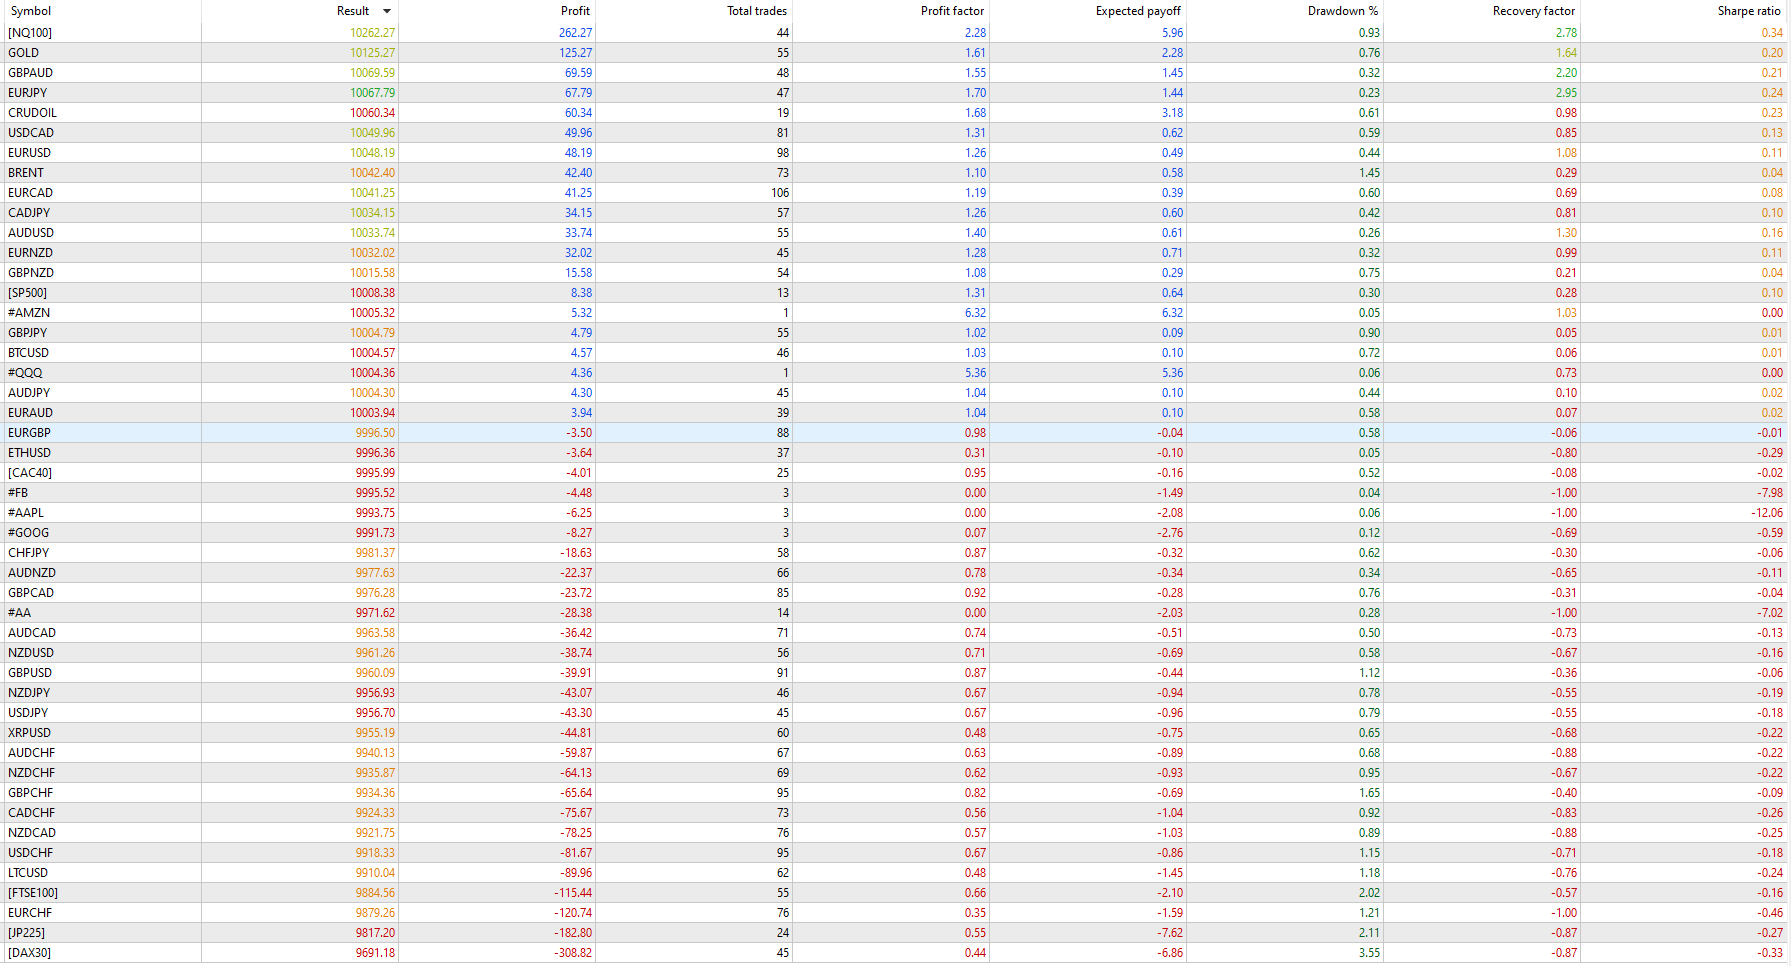
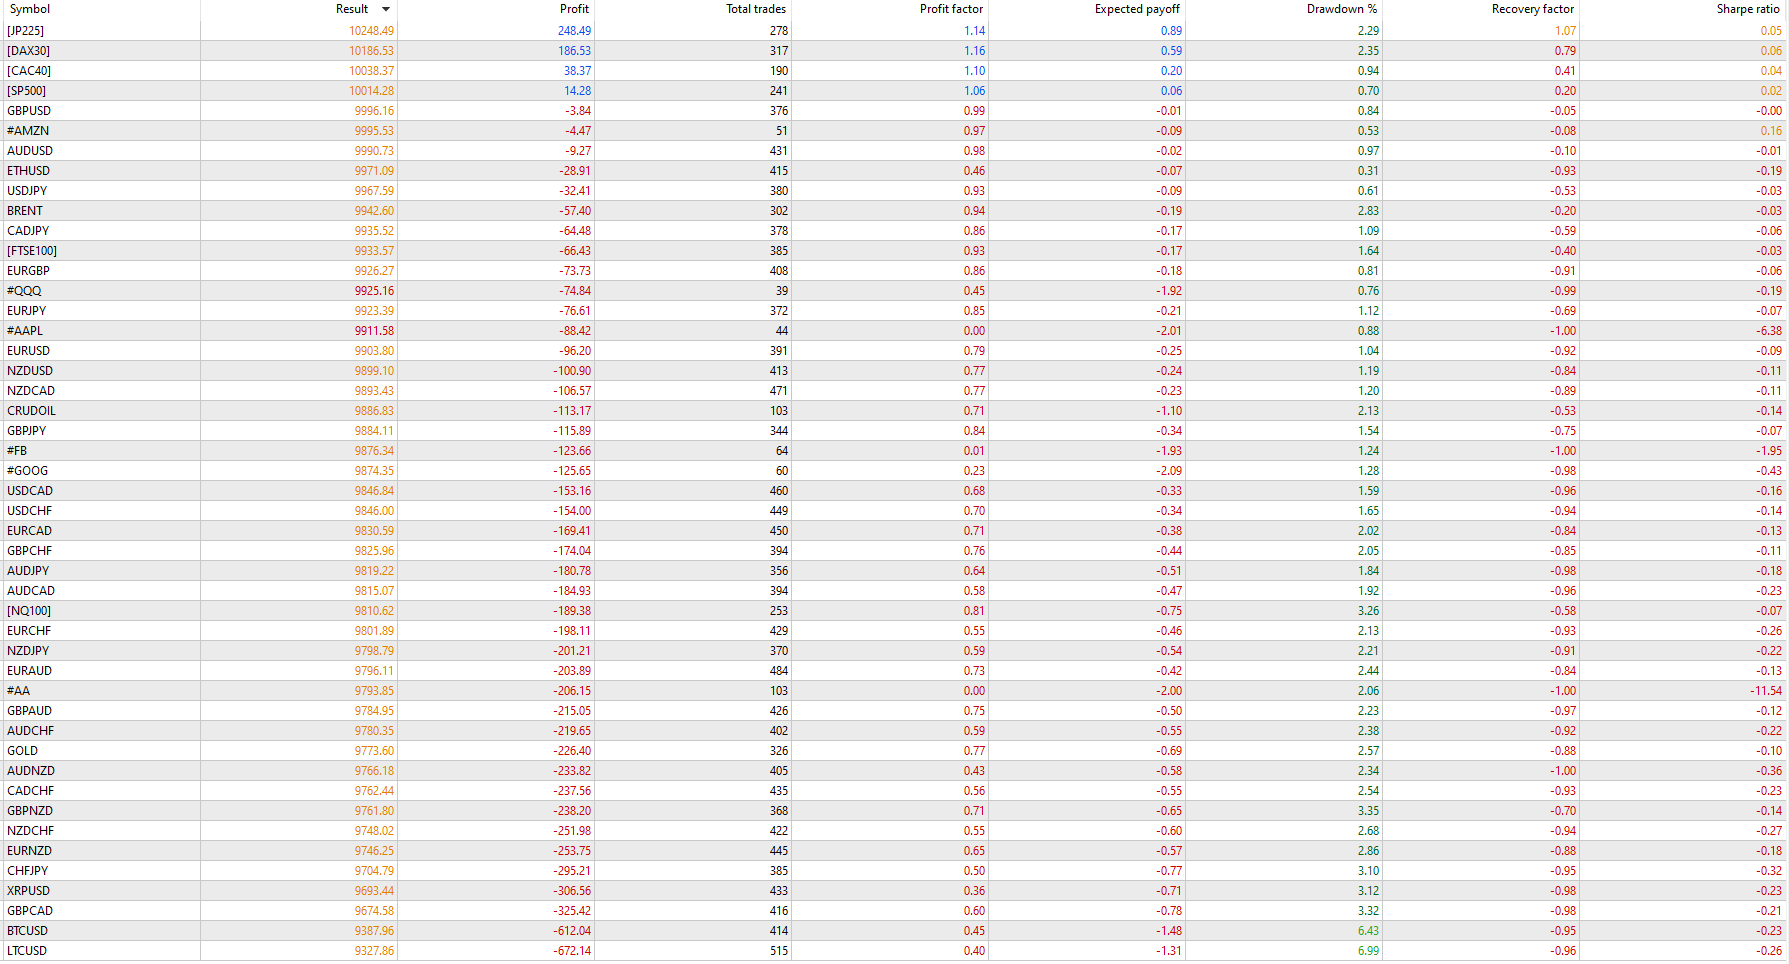
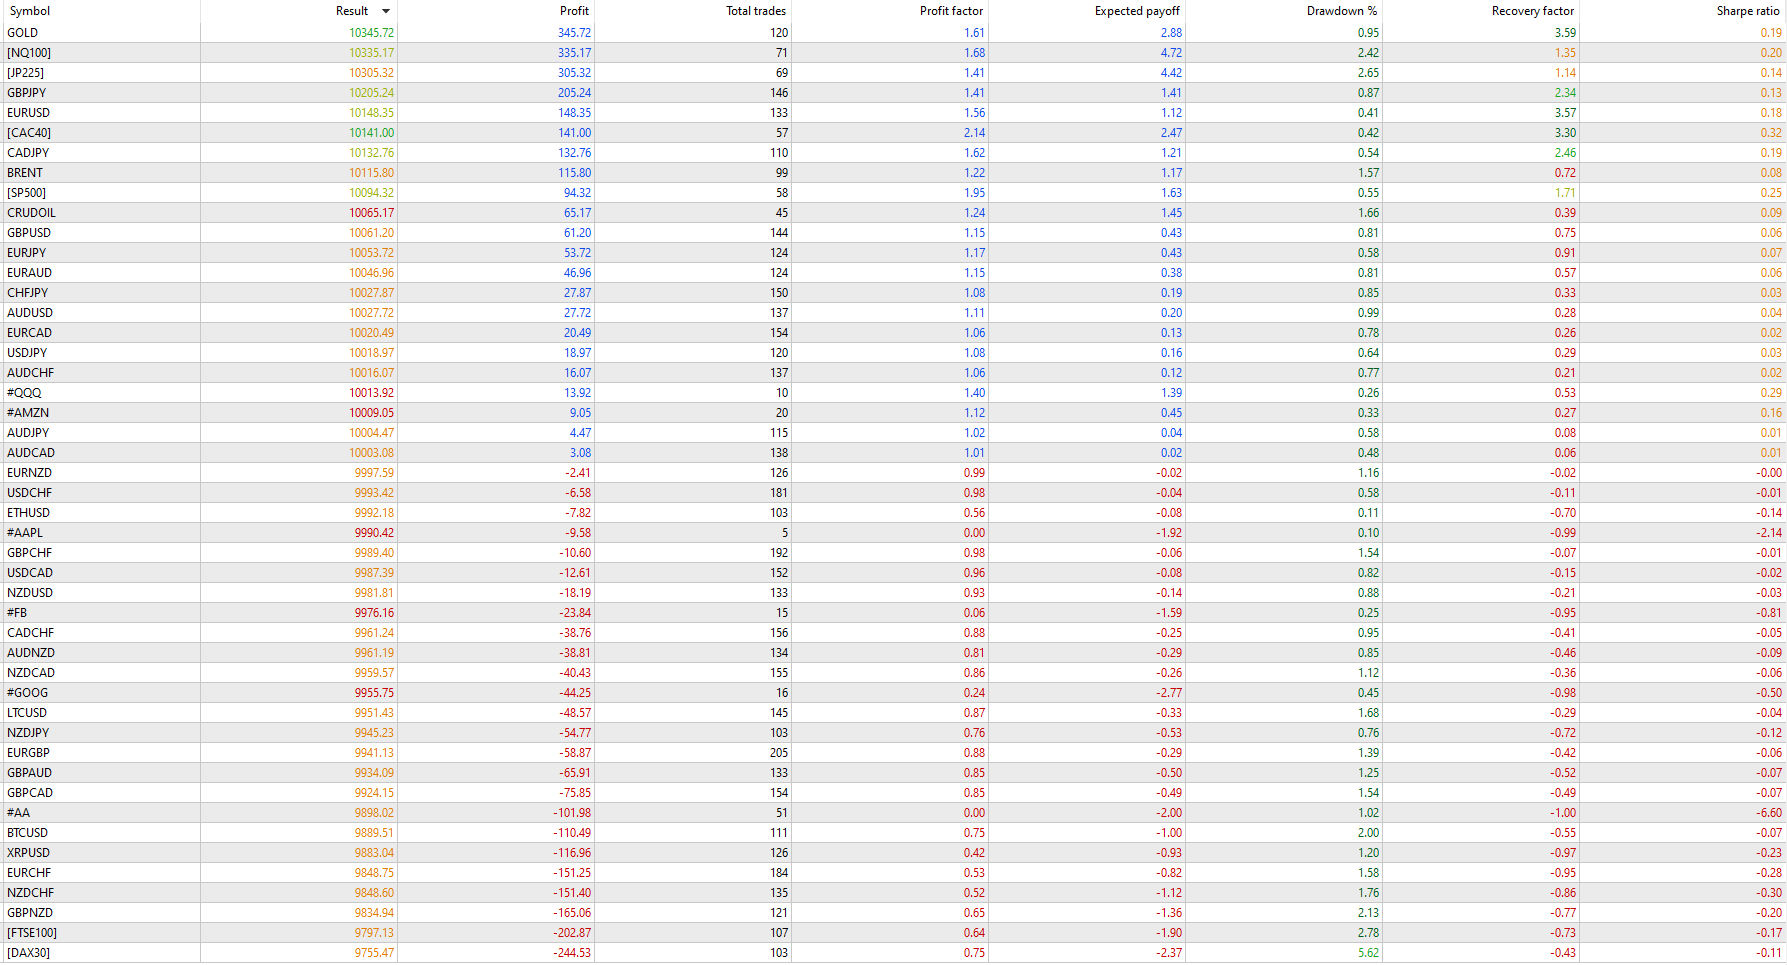
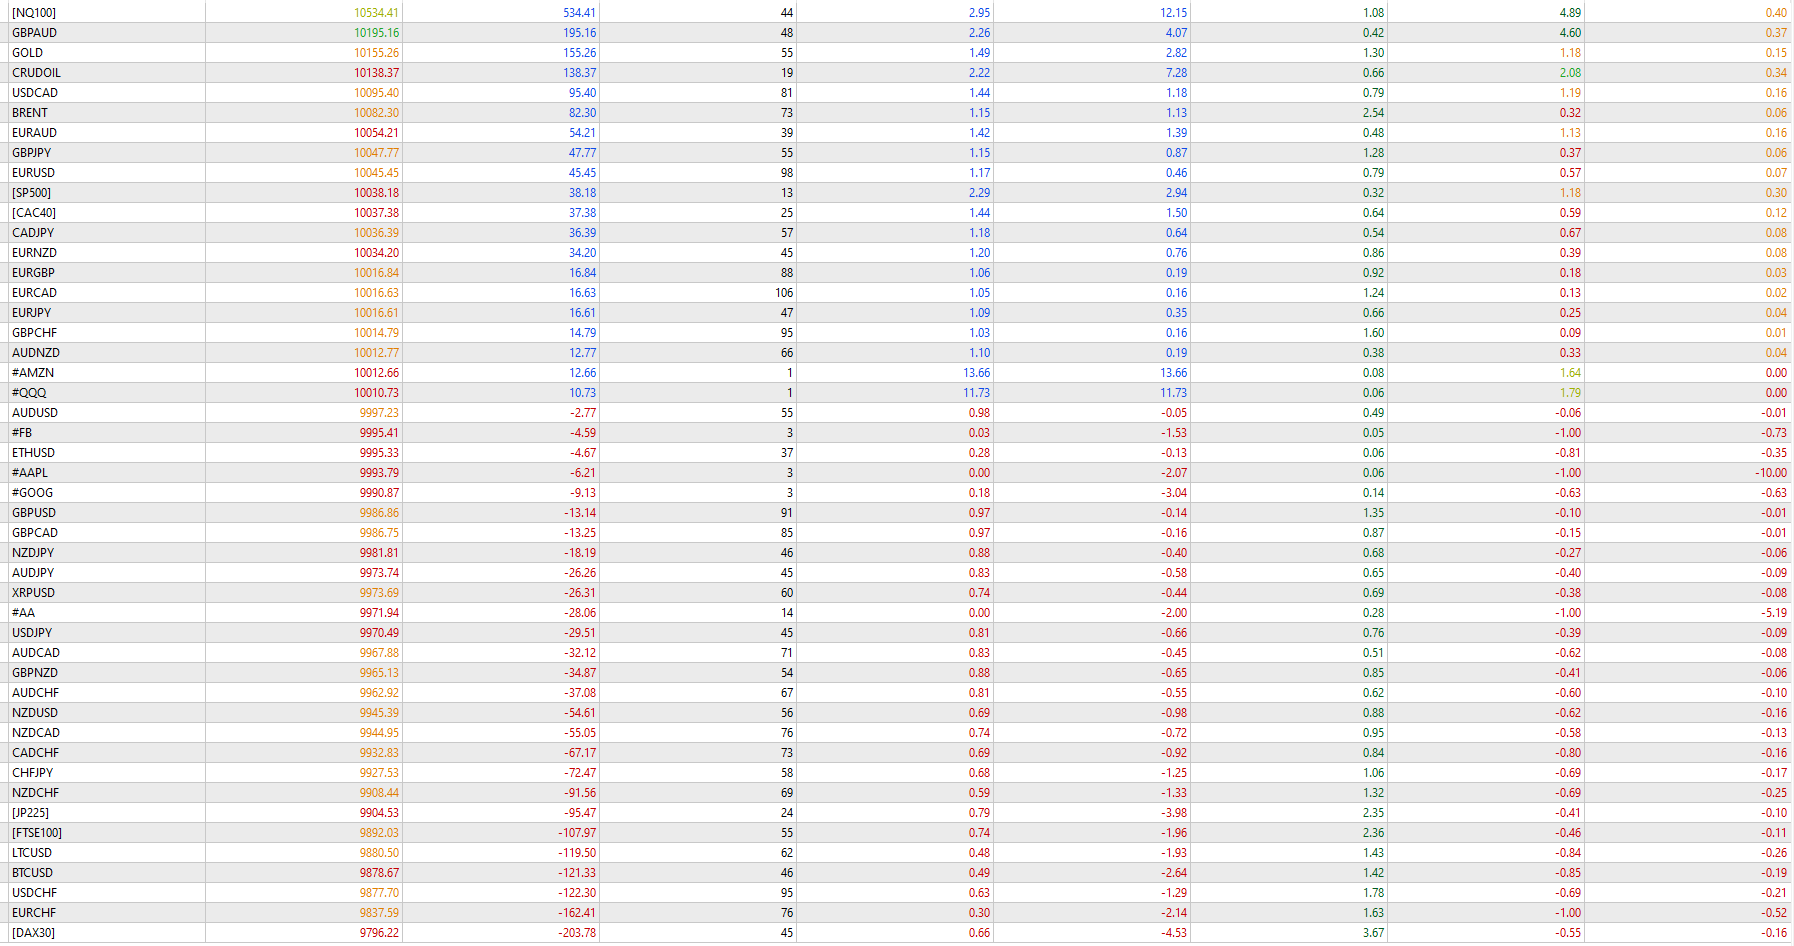
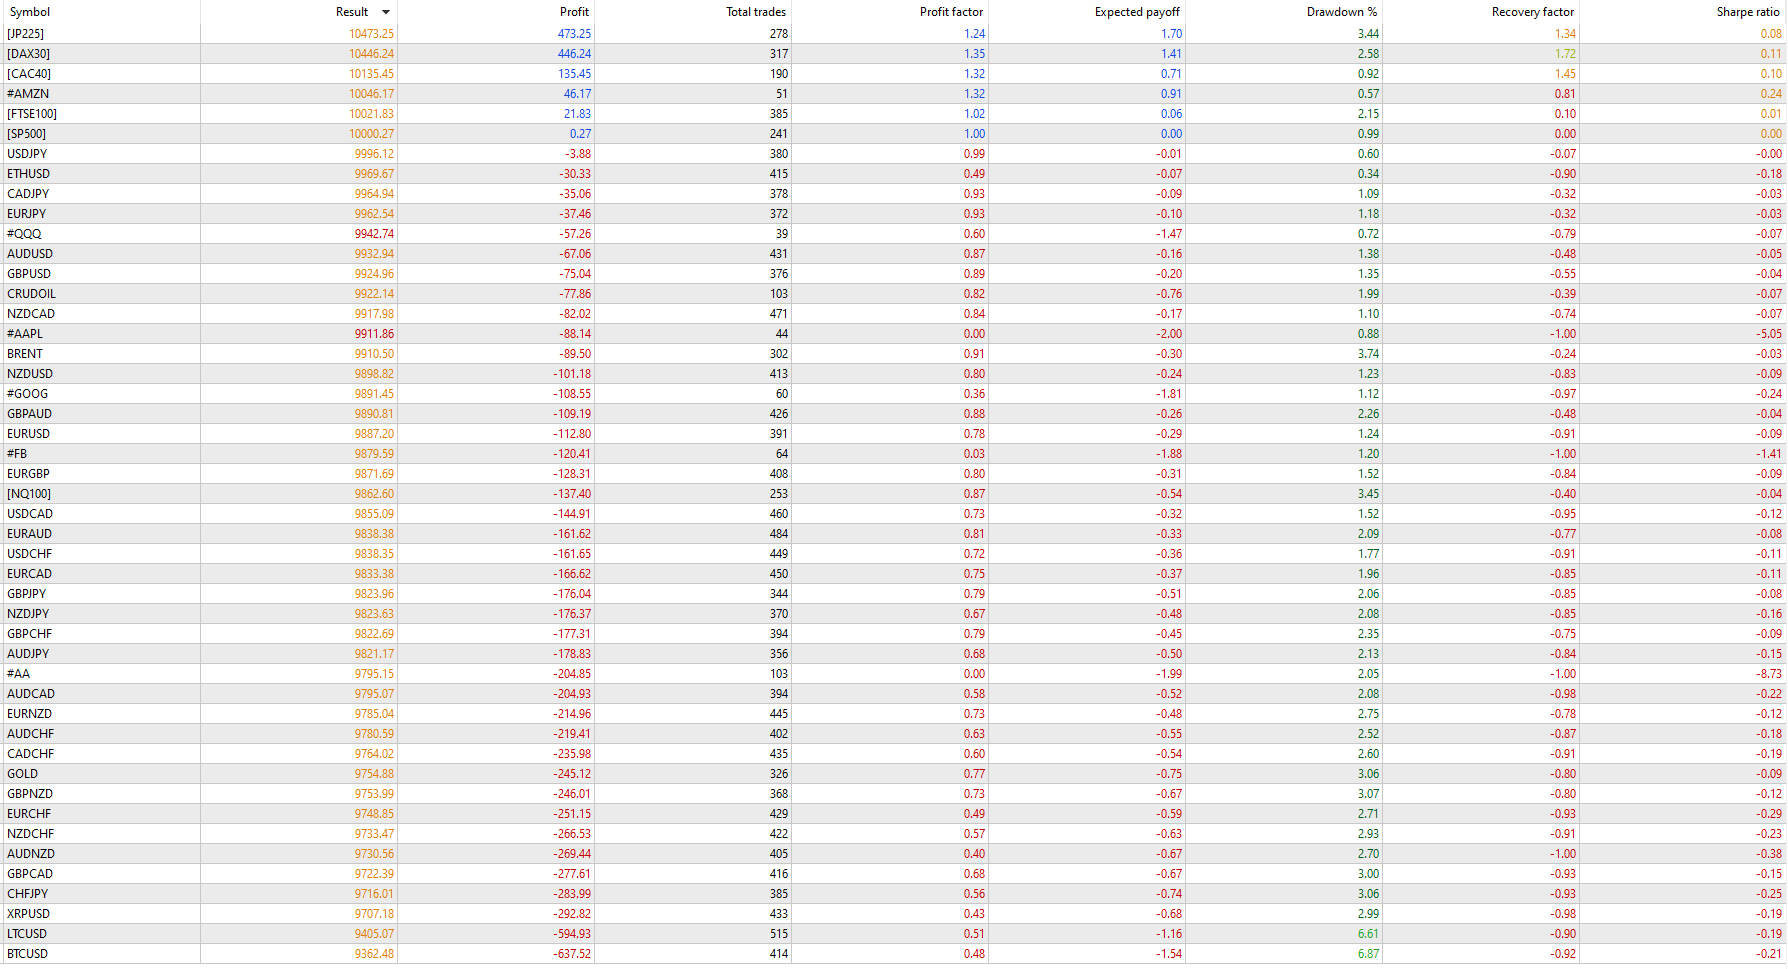
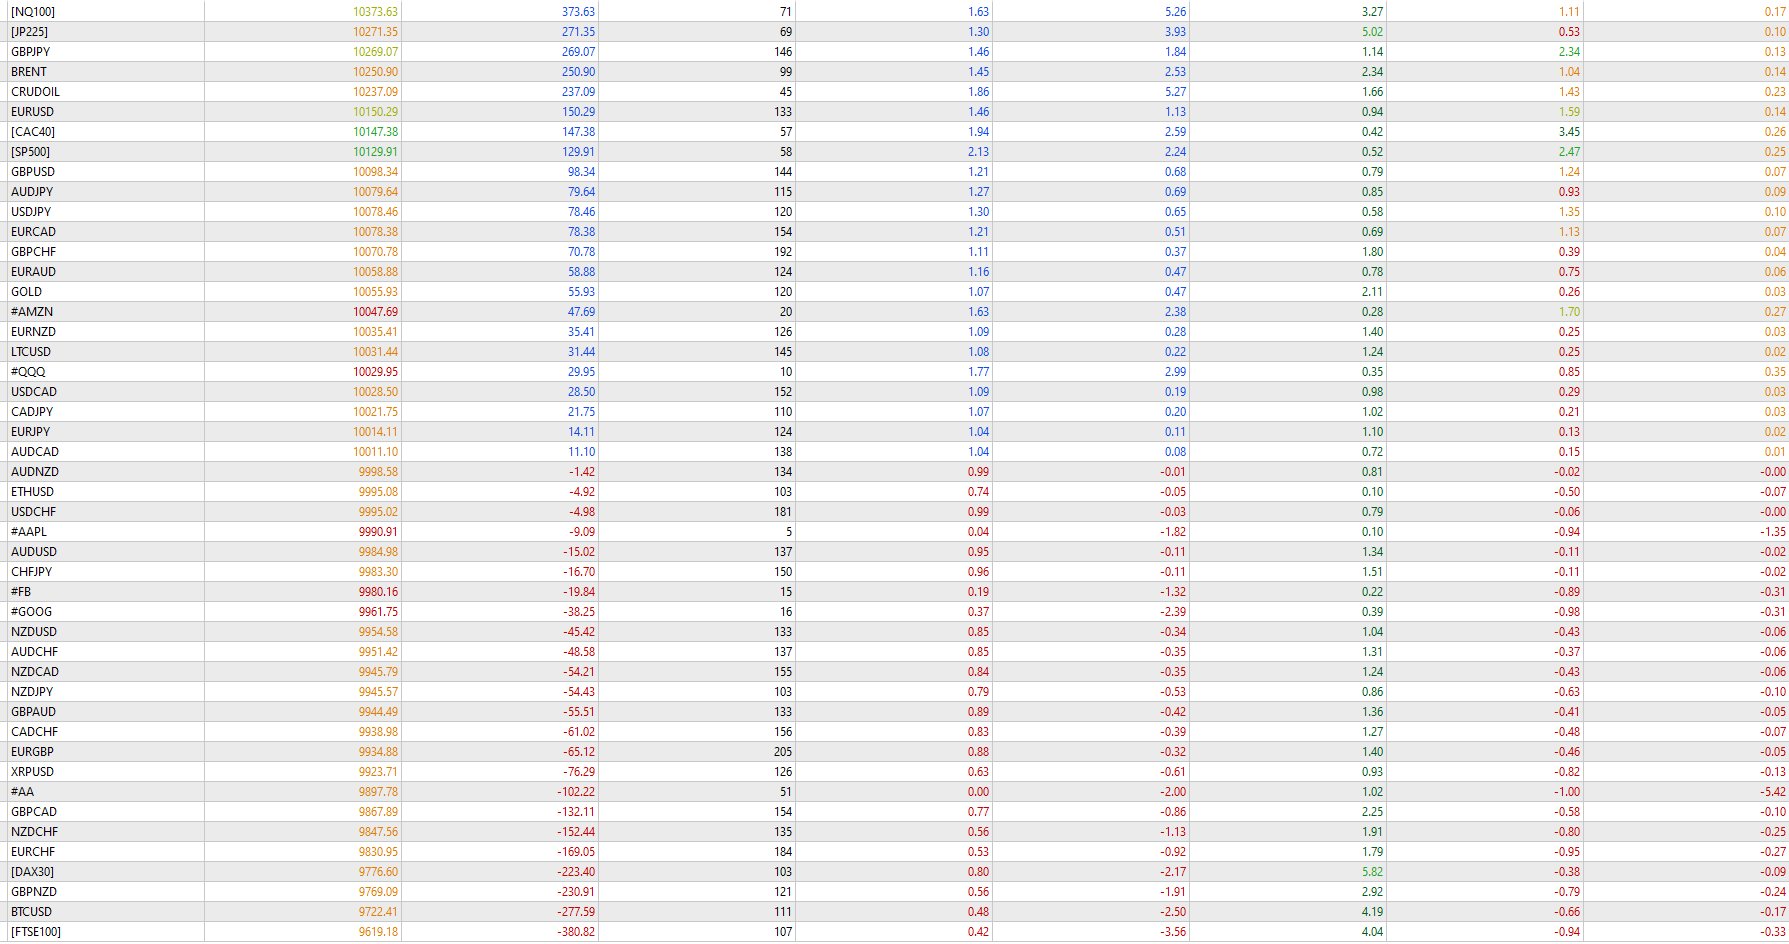
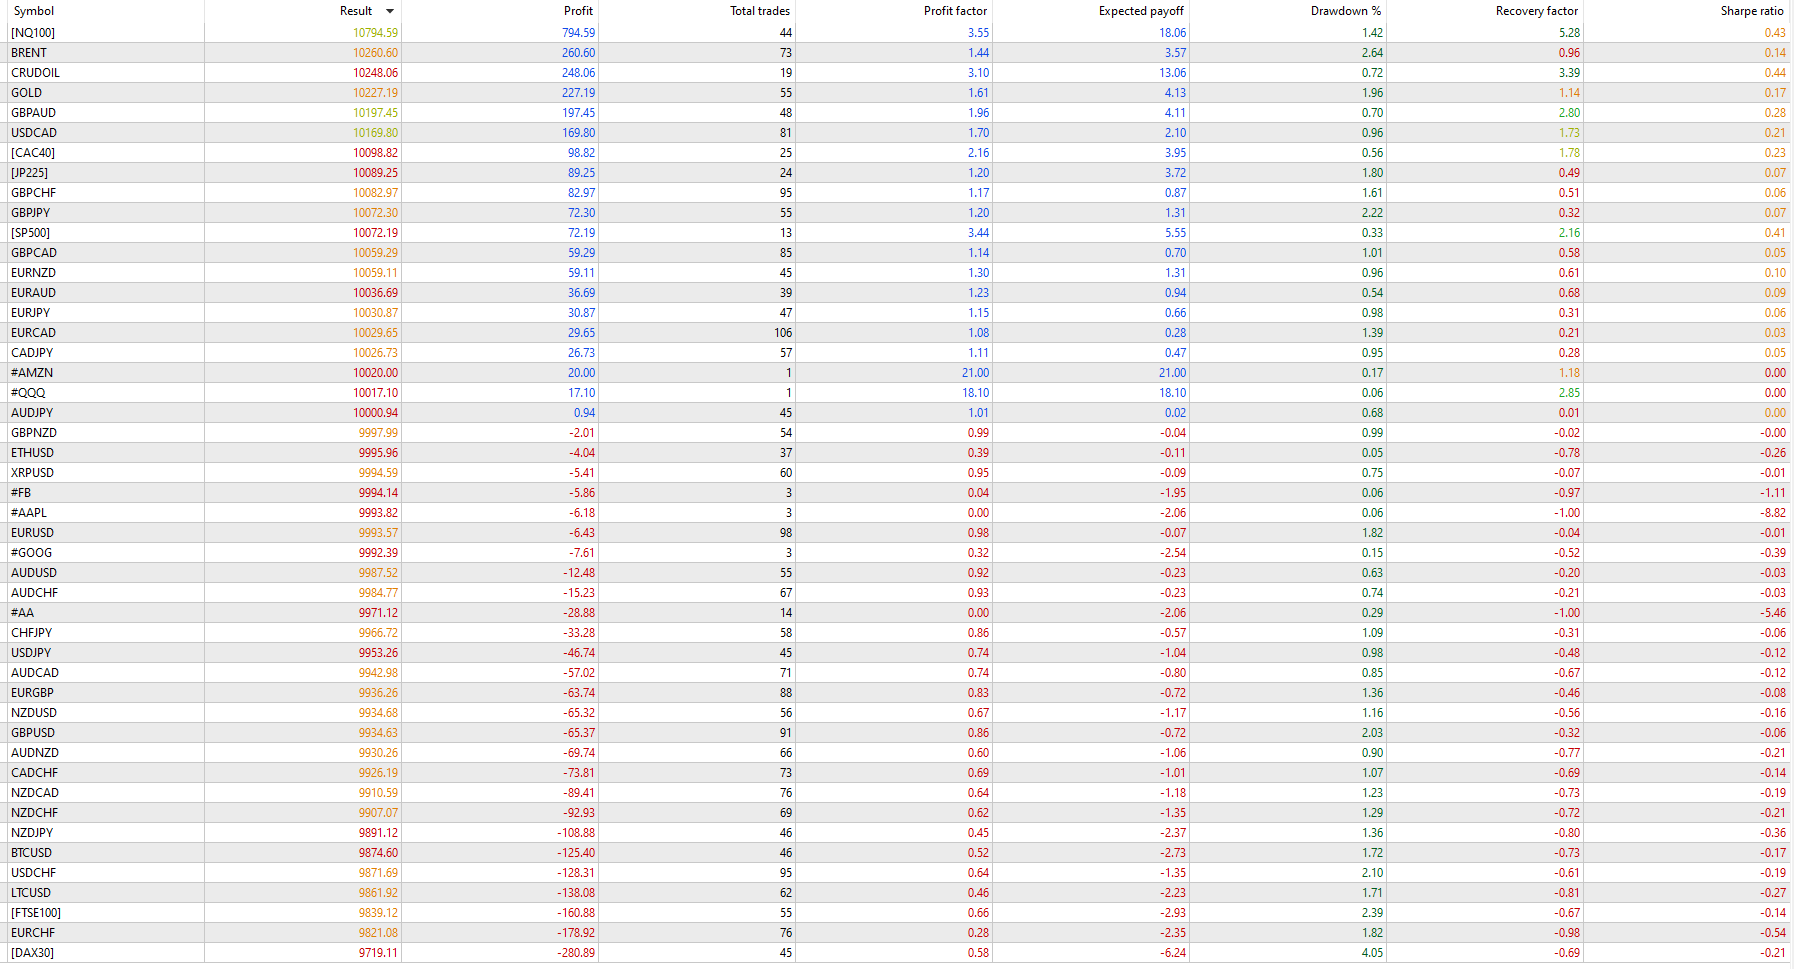
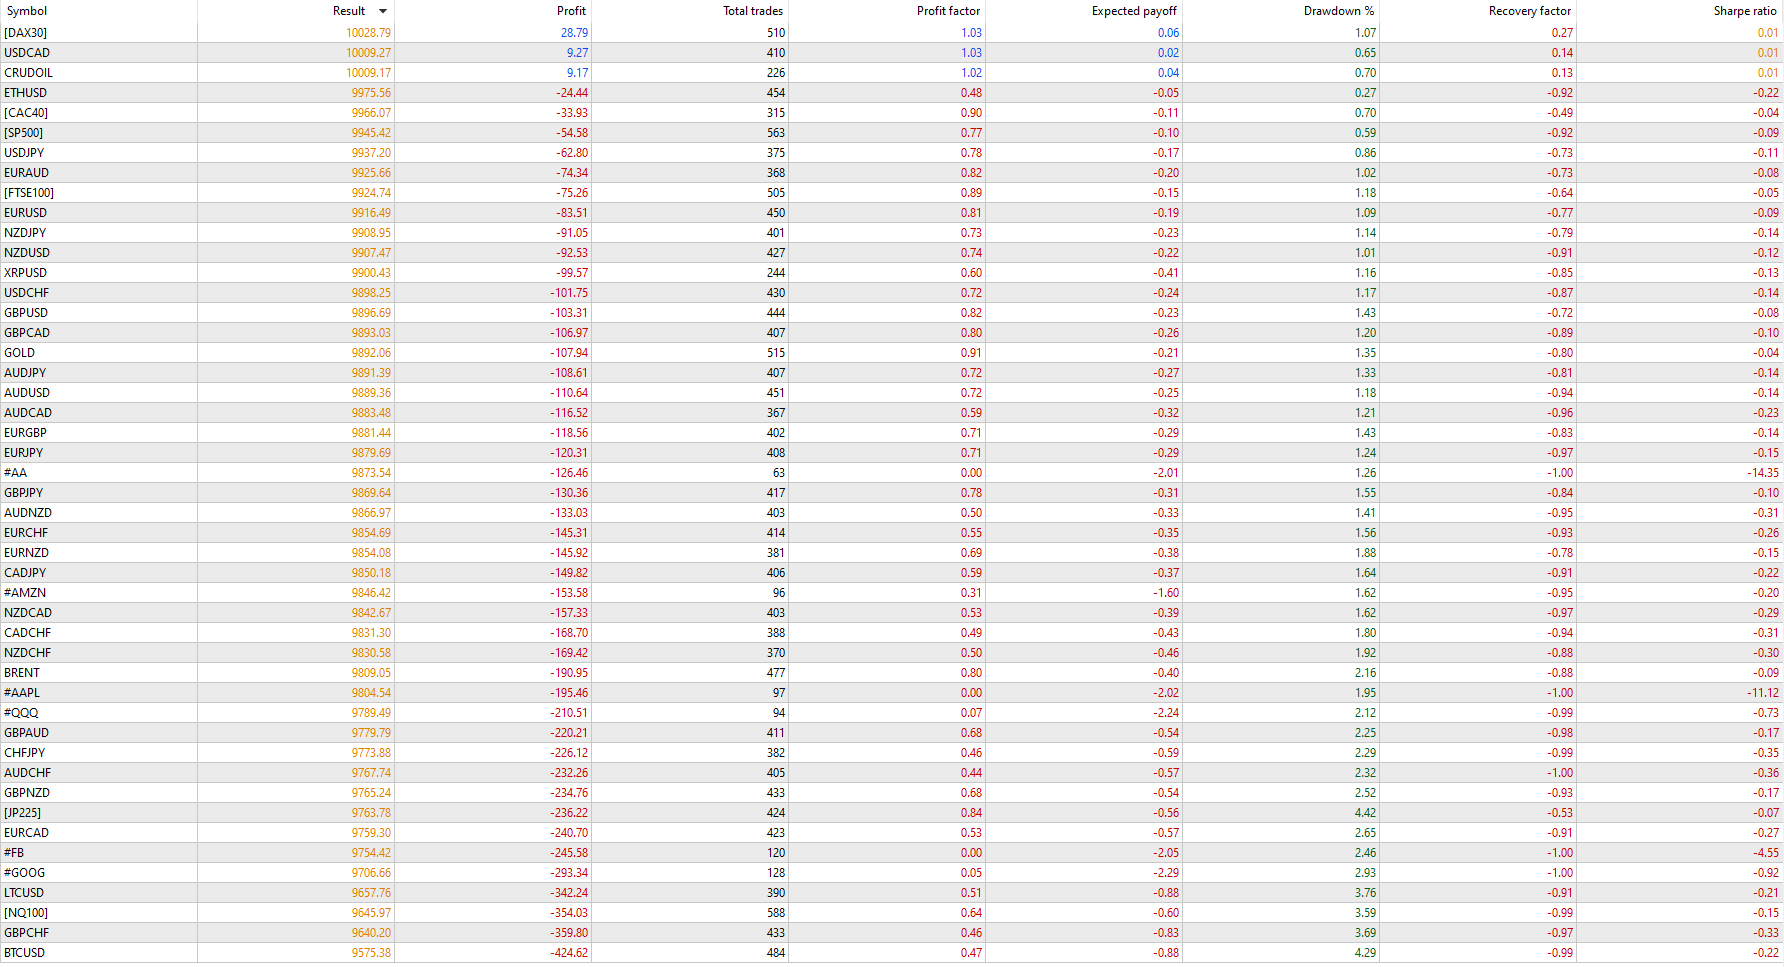
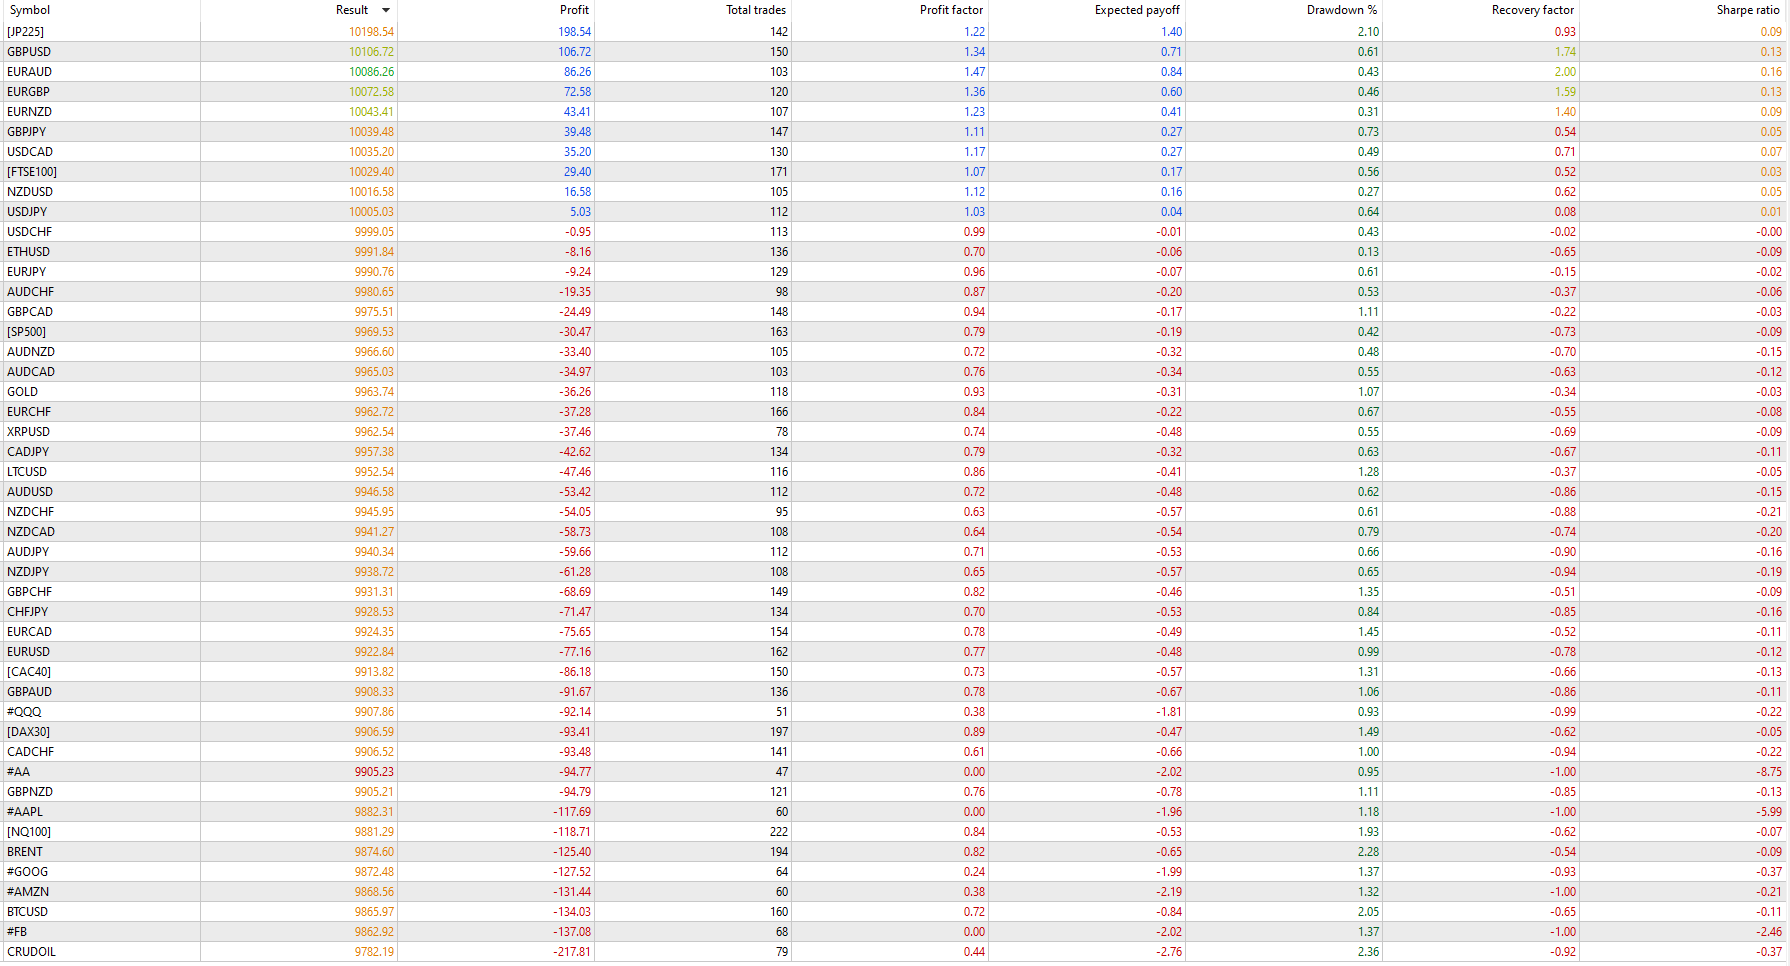
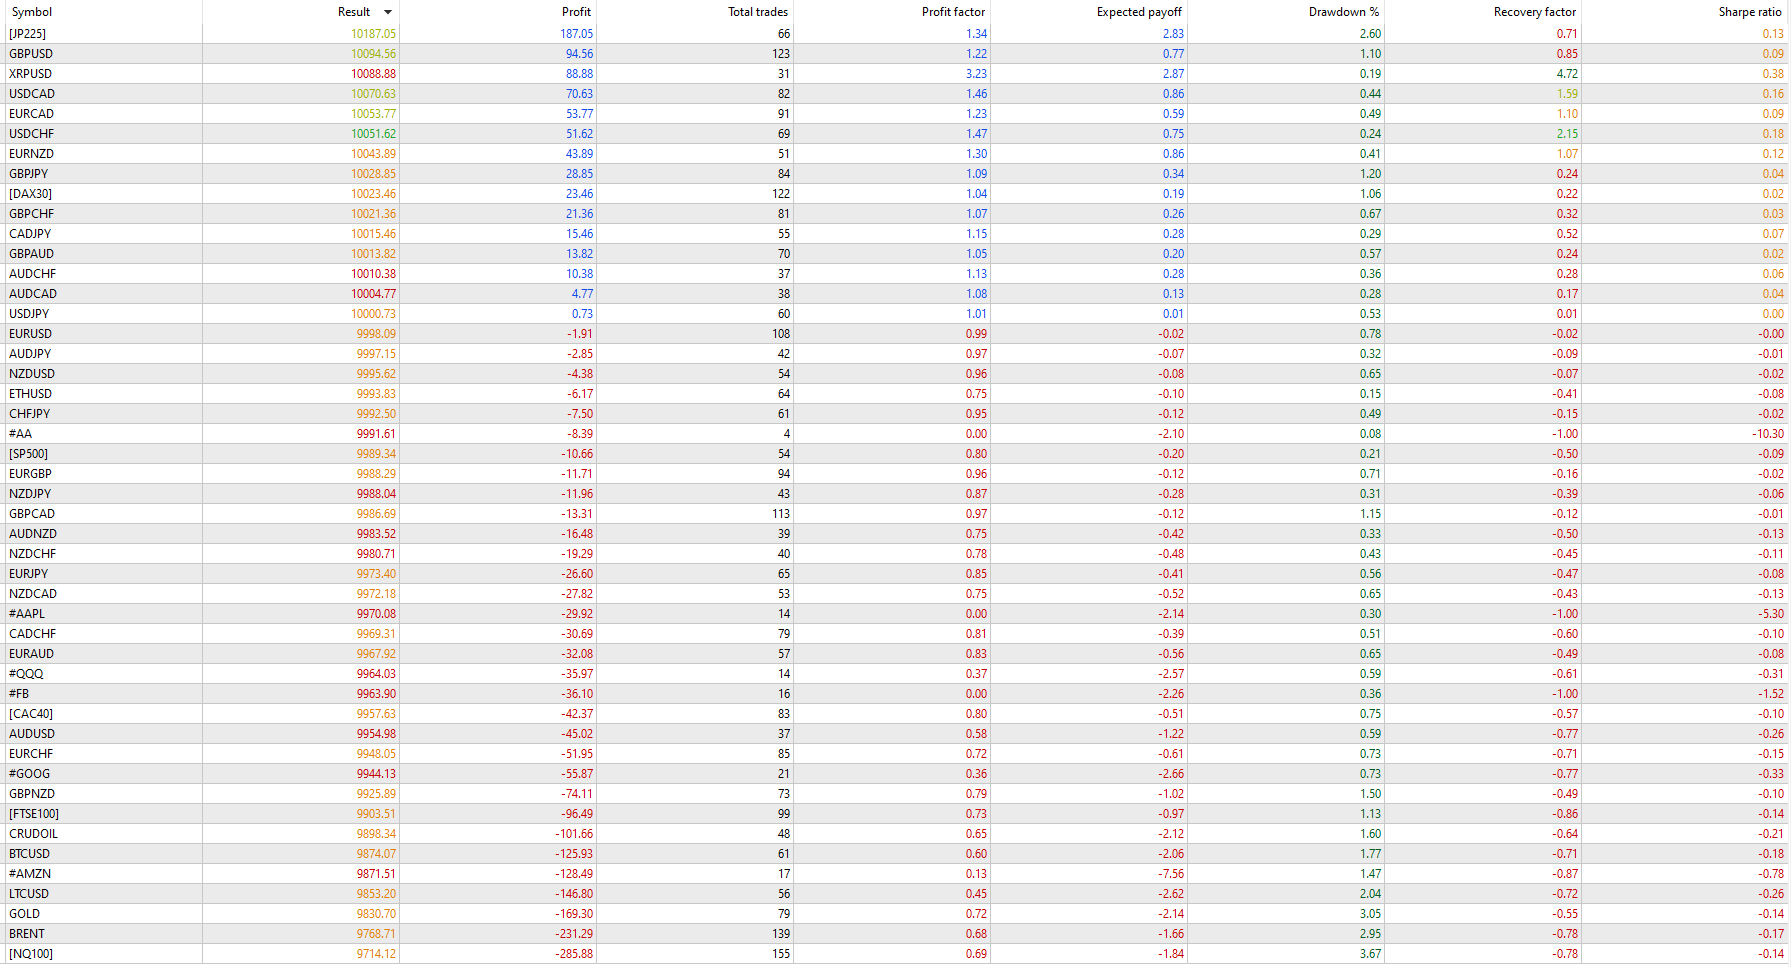
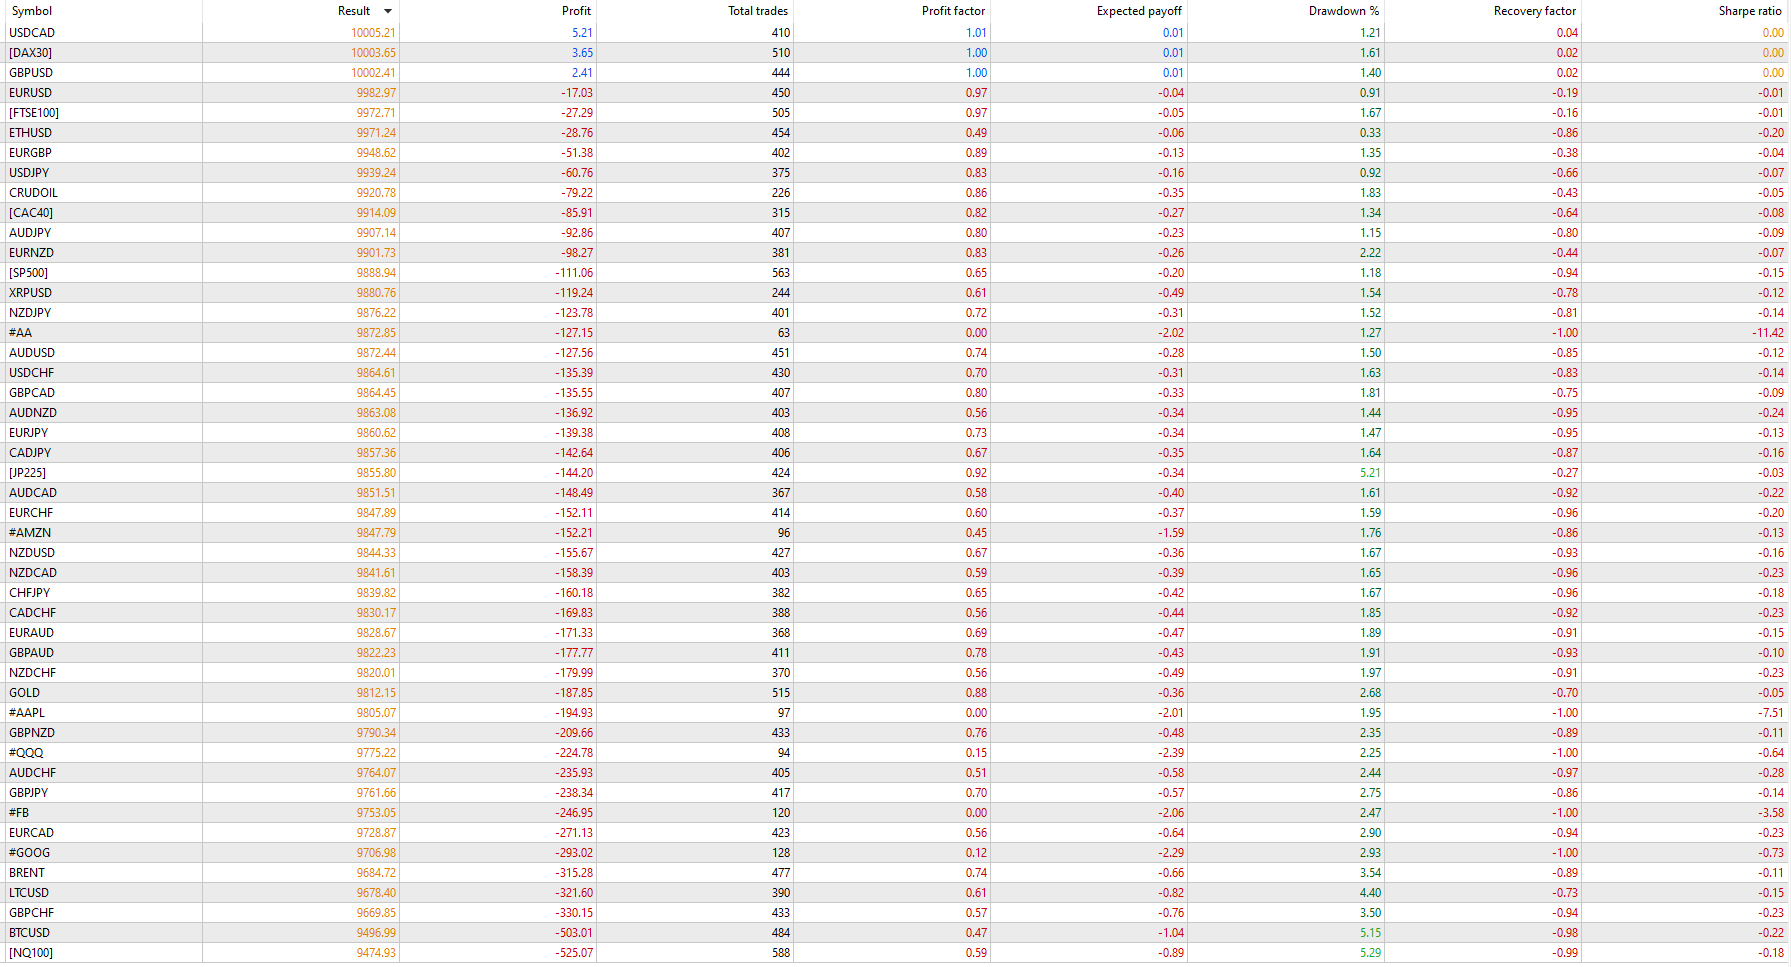
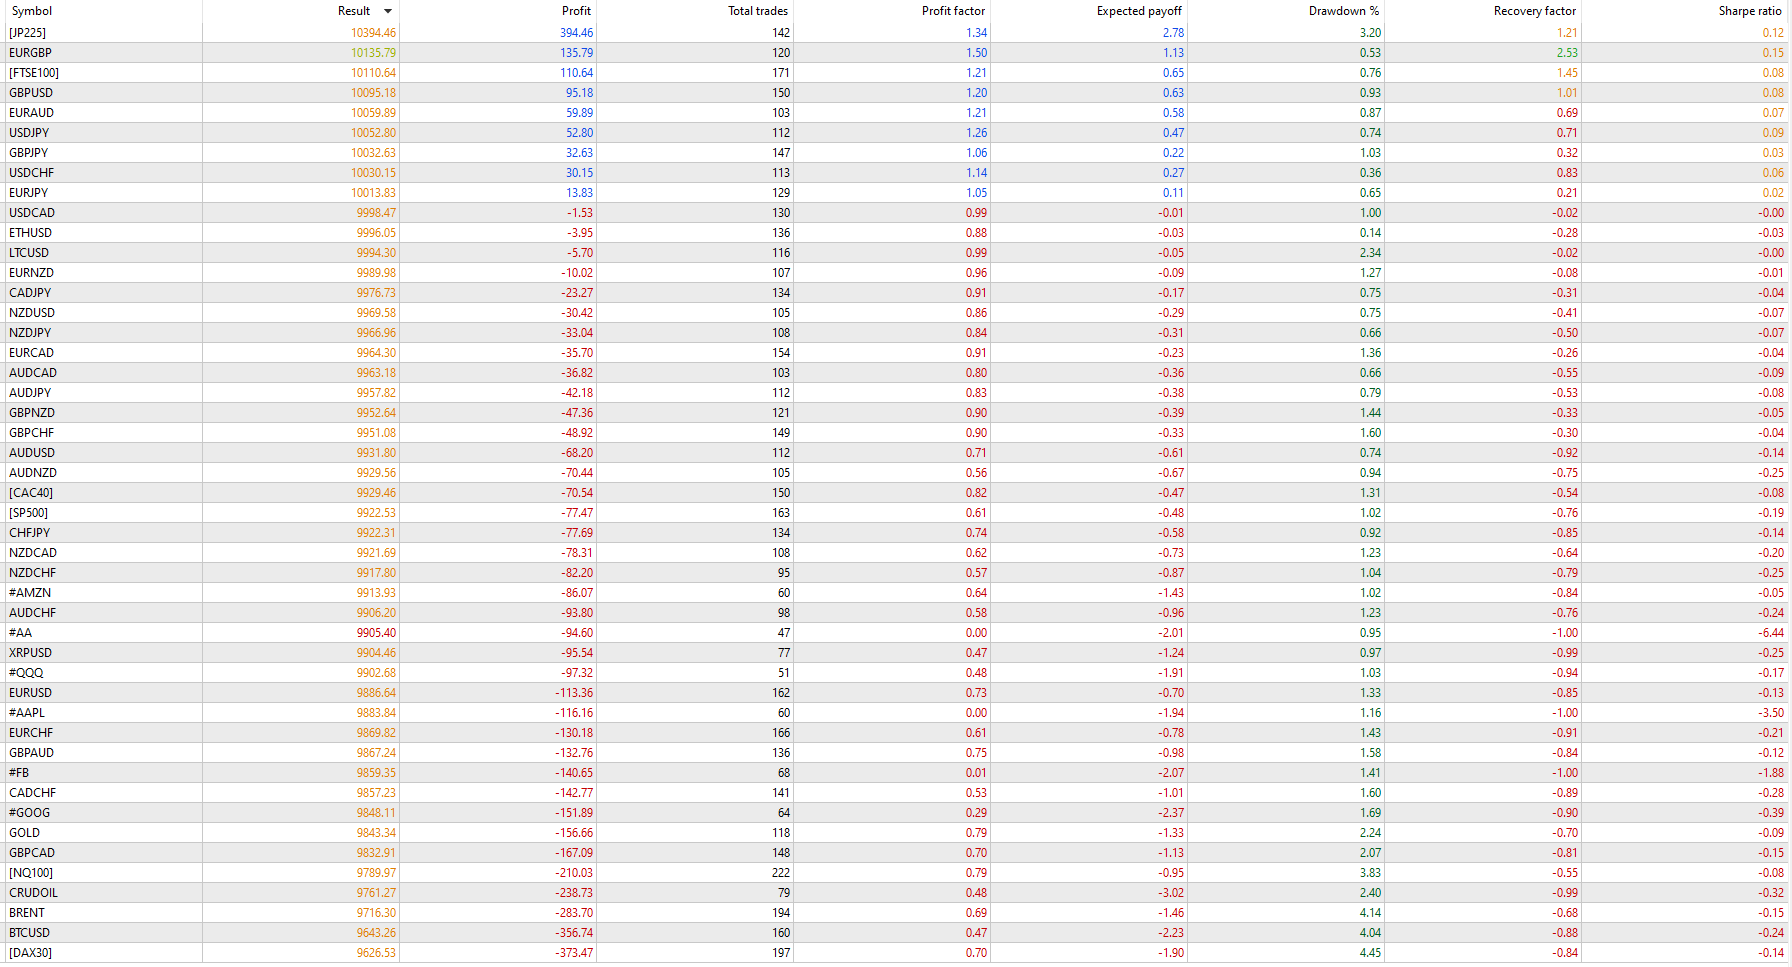
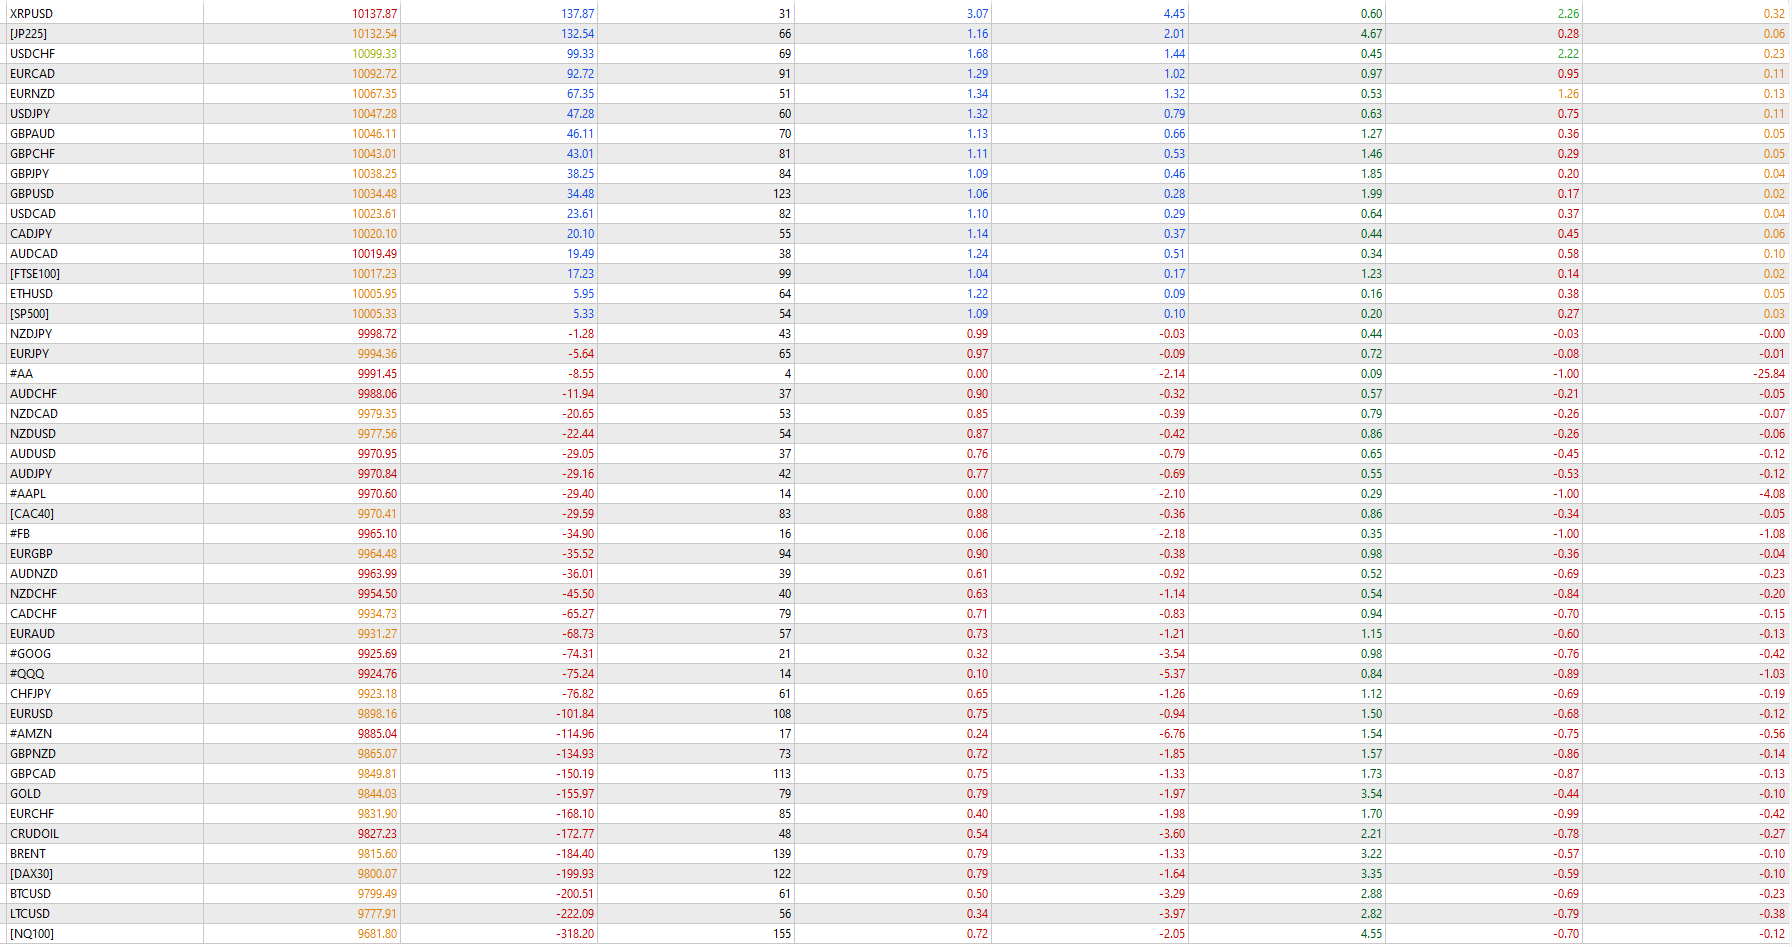
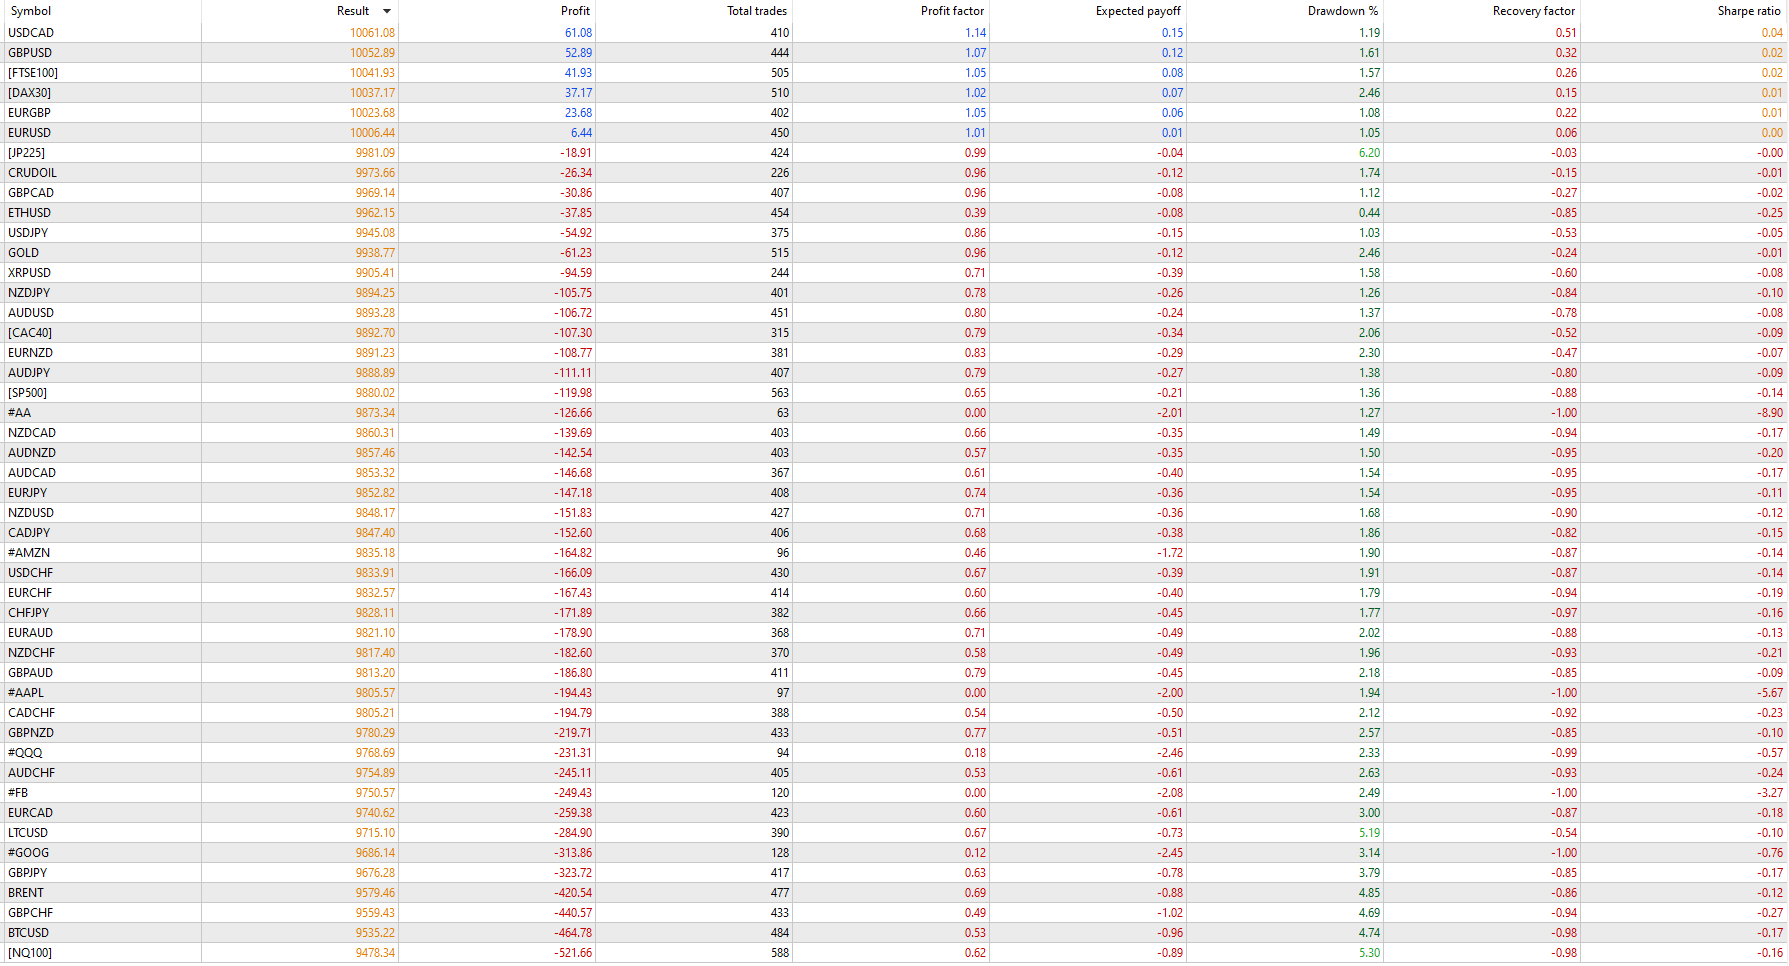
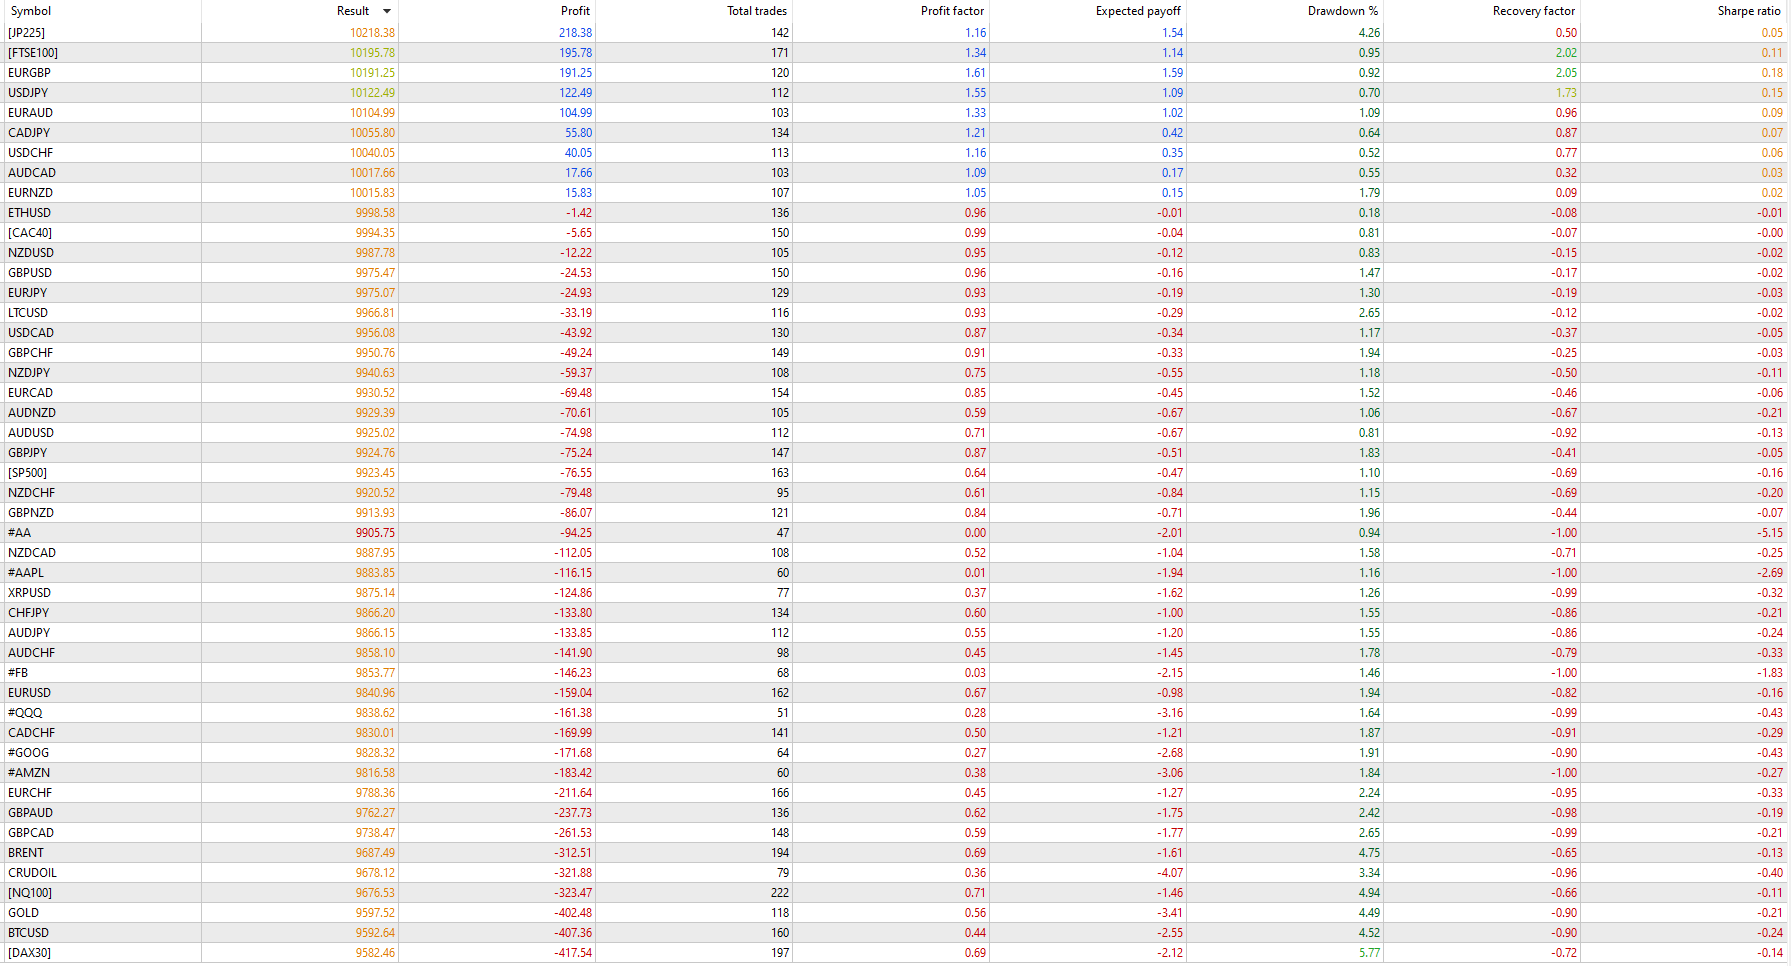
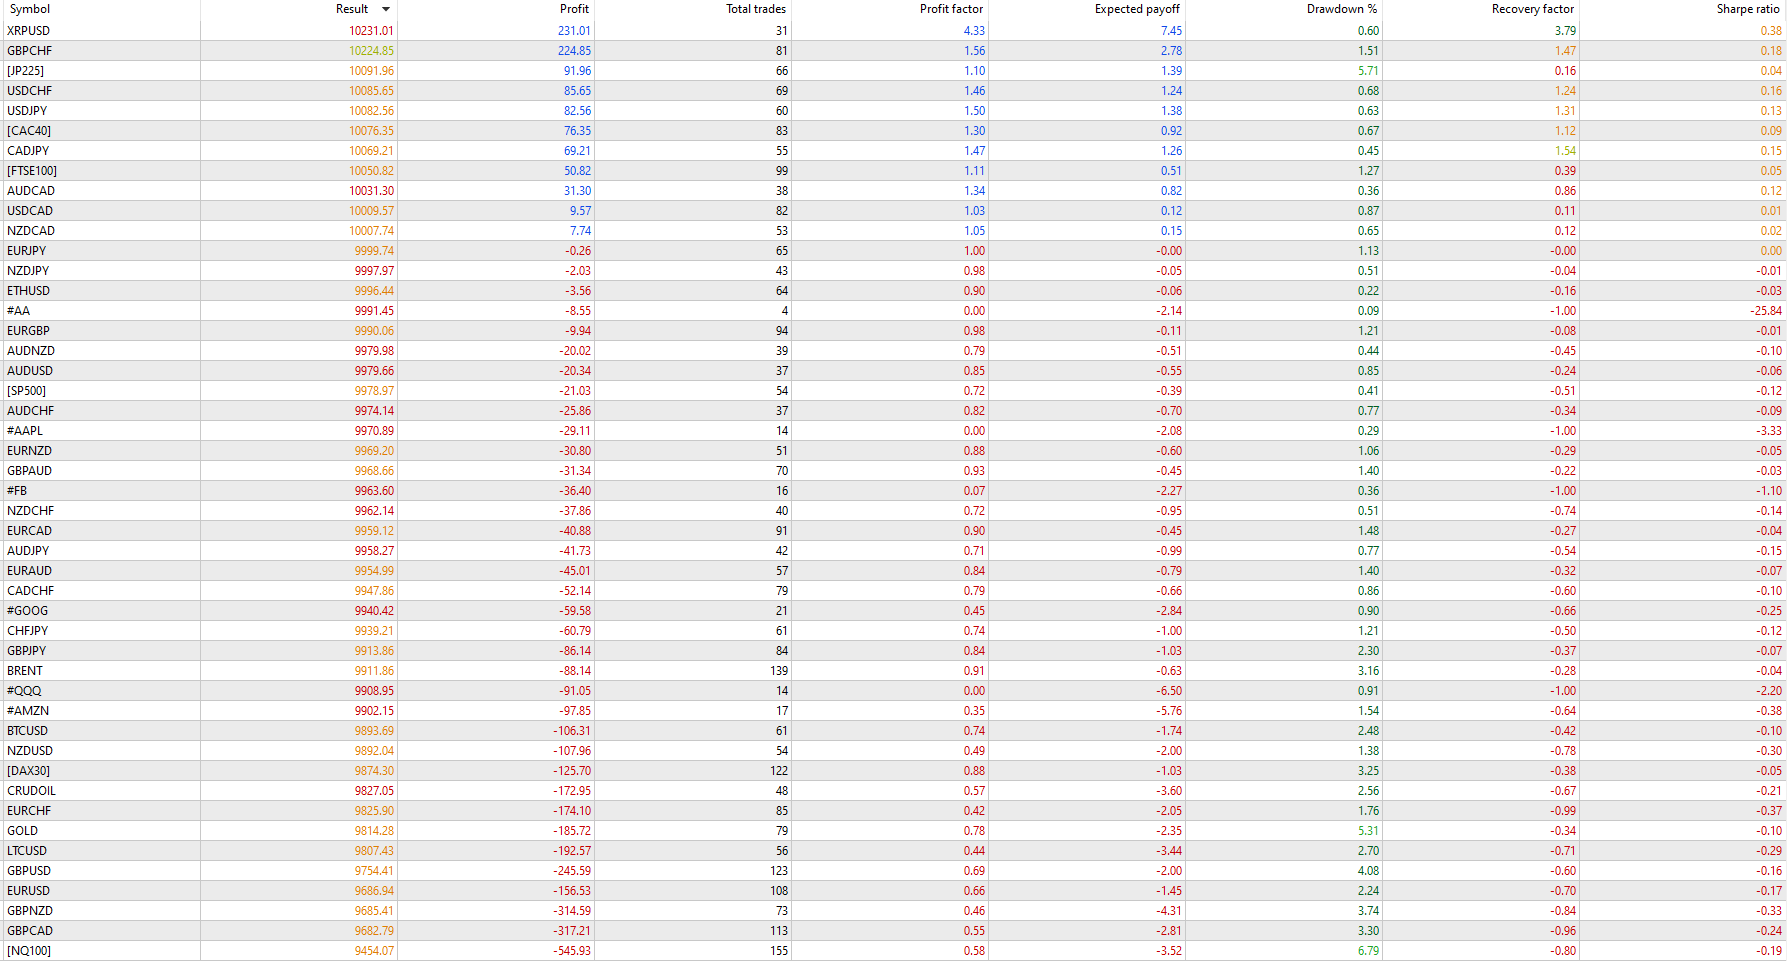
The research shows:
Multiple tests across different assets/markets.
Various models with additional filters added to the entry criteria.
Multiple time frames.
Different trade management approaches – target wise.
Bullish Engulfing Example
(as coded and used in the models)
RULES OF MODEL 1
[bullish engulfing – model 1]
Price is below 200 EMA (Exponential Moving Average) when candle 1 (bullish engulfing candle closes).
Entry – Buy upon closing of candle 1 (bullish engulfing confirmed).
Stop Loss – Below the low of candle 1.
Single Target – fixed risk:reward ratio of 1:1/ 1:2/ 1:3
No trailing stop or any other trade management applied.