Investing Strategy That Beats Buy and Hold
The BBH strategy is now live and available to premium members of Traders Terminal
KEY TAKEAWAYS
- Data period: 1974-2022
- Idea based on academic papers
- Lower risk
- Better or equal returns (compared to a “Buy and Hold” approach)
- Benchmark – SPY/SPX
- No leverage / margin
SUMMARY
A while ago I read a few papers, the authors of which were examining methods of decreasing the volatility in the returns of a buy and hold investment approach. While these papers inspired me to dig deeper into the idea, all researchers came to the same conclusion:
- Lower volatility (and subsequently lower drawdowns), leads to lower performance.
While this is acceptable for certain cases and risk profiles i think that cutting the performance is half is too much of a trade off.
That’s what led me to conduct this research and come up with the suggested investment strategy(BBH). So equipped with the results of the academic papers and the motivation to crossbreed intraday trading skills and knowledge with investing strategies I rolled up my sleeves and got busy.
GOALS
- Strategy that delivers at least the same or higher returns compared to buy and hold (benchmark SPY/SPX).
- Lower drawdowns.
- Minimum amount of time required to manage.
RESULTS
- Fees/Commission are not taken into account
- The data is not inflation adjusted
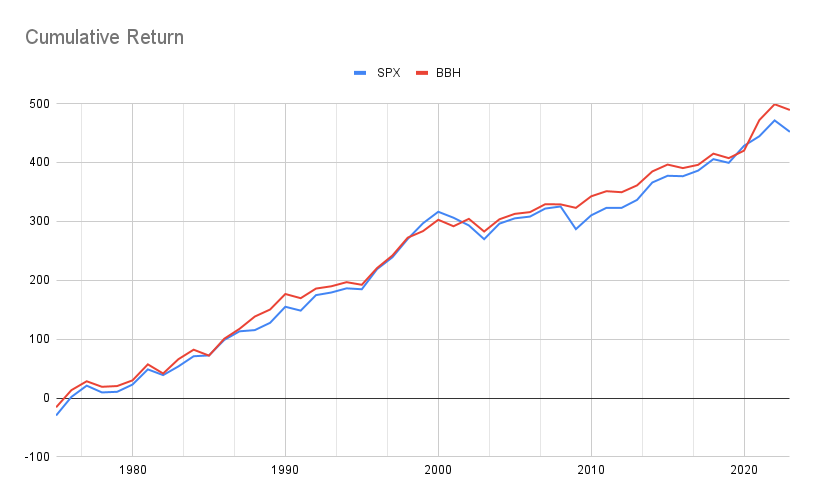
Even though there are a few moments in history when SPX outperformed, in general the strategy is solid.
- Annualized Average Return SPX 9.22%
- Annualized Average Return BBH: 9.98%
As usual I like to put the percentages in perspective and see what they represent. This is how the 8.2% increase influences your balance:
| Starting Balance | $100,000 | Difference | |
|---|---|---|---|
| Average Annual Return | 9.22% | 9.98% | - |
| Balance in 10 years | $241,558 | $258,903 | $17,345 |
| Balance in 15 years | $375,433 | $416,587 | $41,154 |
| Balance in 20 years | $583,503 | $670,308 | $86,805 |
| Balance in 25 years | $906,889 | $1,078,556 | $171,667 |
This is how the annual returns look like for both:
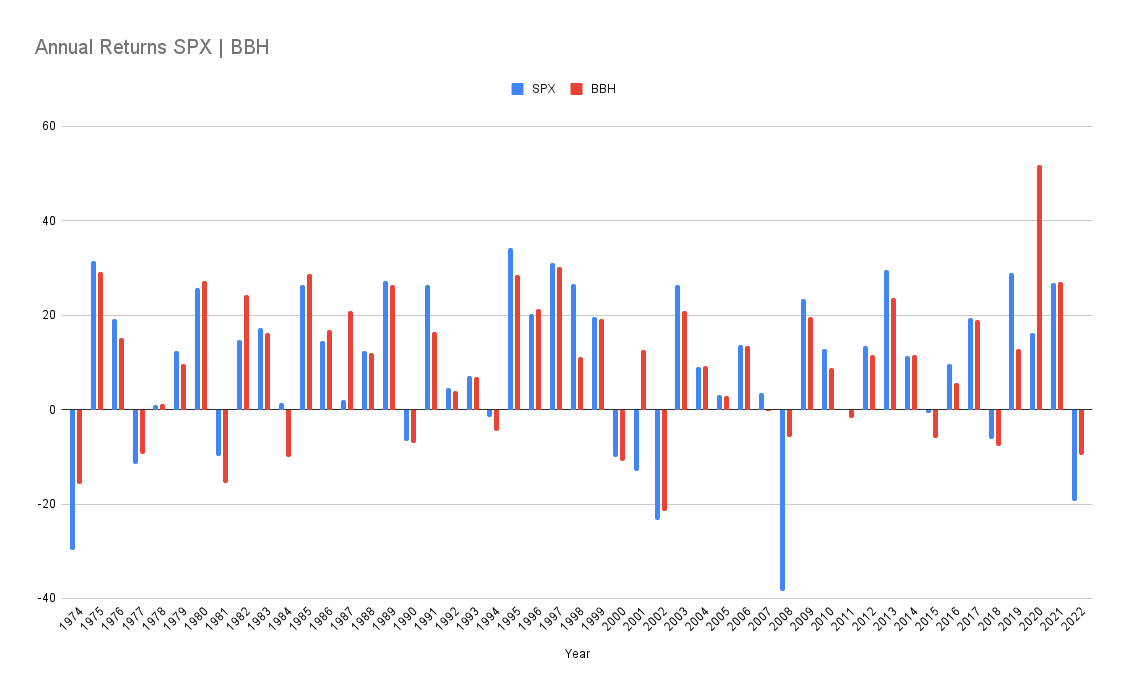
Now let’s isolate the positive years and focus on the negative ones alone. It is interesting to mention that BBH strategy had 2 extra negative years in otherwise equal count.
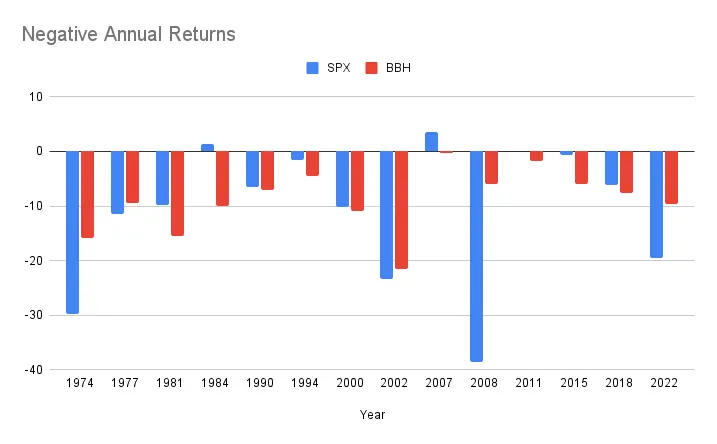
The min/ max and average values (inversed for negative values).
| Max Annual Drawdown | -38.49% | -21.5% |
|---|---|---|
| Min Annual Drawdown | -0.73% | -0.3% |
| Average Annual Drawdown | -10.89% | -9.0% |
We don’t see much of a difference in the average category but there is notable difference in the Max values.
A 44.14% improvement.
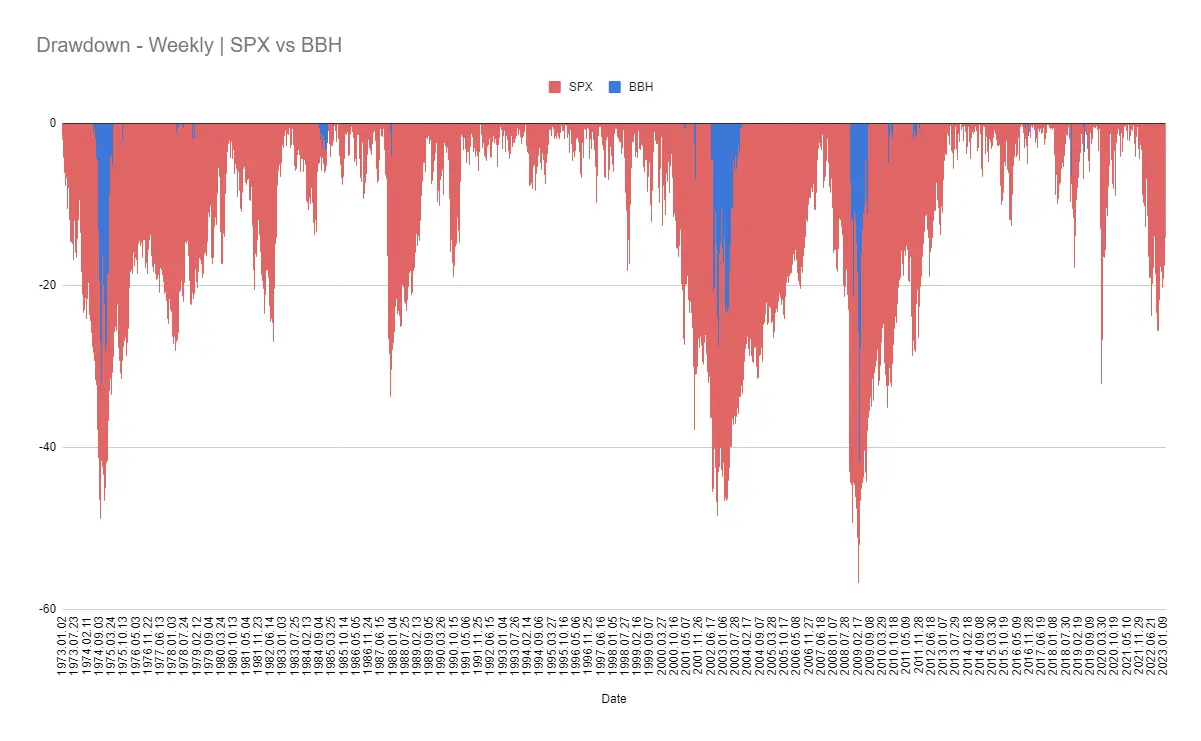
INTRA-YEAR DRAWDOWNS
Ok moving on to something that probably doesn’t bother too much the long term investors. The intra-year drawdowns. I have compiled weekly data points so we can see in even more detail what happened where.
For me what stands out in this image is the fact that the drawdown periods (blue zones) of the BBH strategy are significantly less compared to SPX. There are 3 notable drawdown occasions where the DD dipped below the 20% mark: 1974, 2002, 2009, while we see 8 occurrences for SPX.
Number of drawdowns of 20% or more:
- SPX: 8
- BBH: 3
Max intra-year drawdown:
- SPX: -57% (2009)
- BBH: -41% (2009)
BBH STRATEGY
The BBH strategy is free and exclusive for all premium members of the Traders Terminal.
CONCLUSION
Whether this strategy will continue to perform in a similar manner only time will tell but I like the odds and the numbers so far.
Overfitting here is not a big concern for me because the strategy is dead simple and truth be told, there wasn’t much of optimization. On top of that the Monte Carlo analysis shows robust performance is to be expected.
Happy Trading!
Yordan K